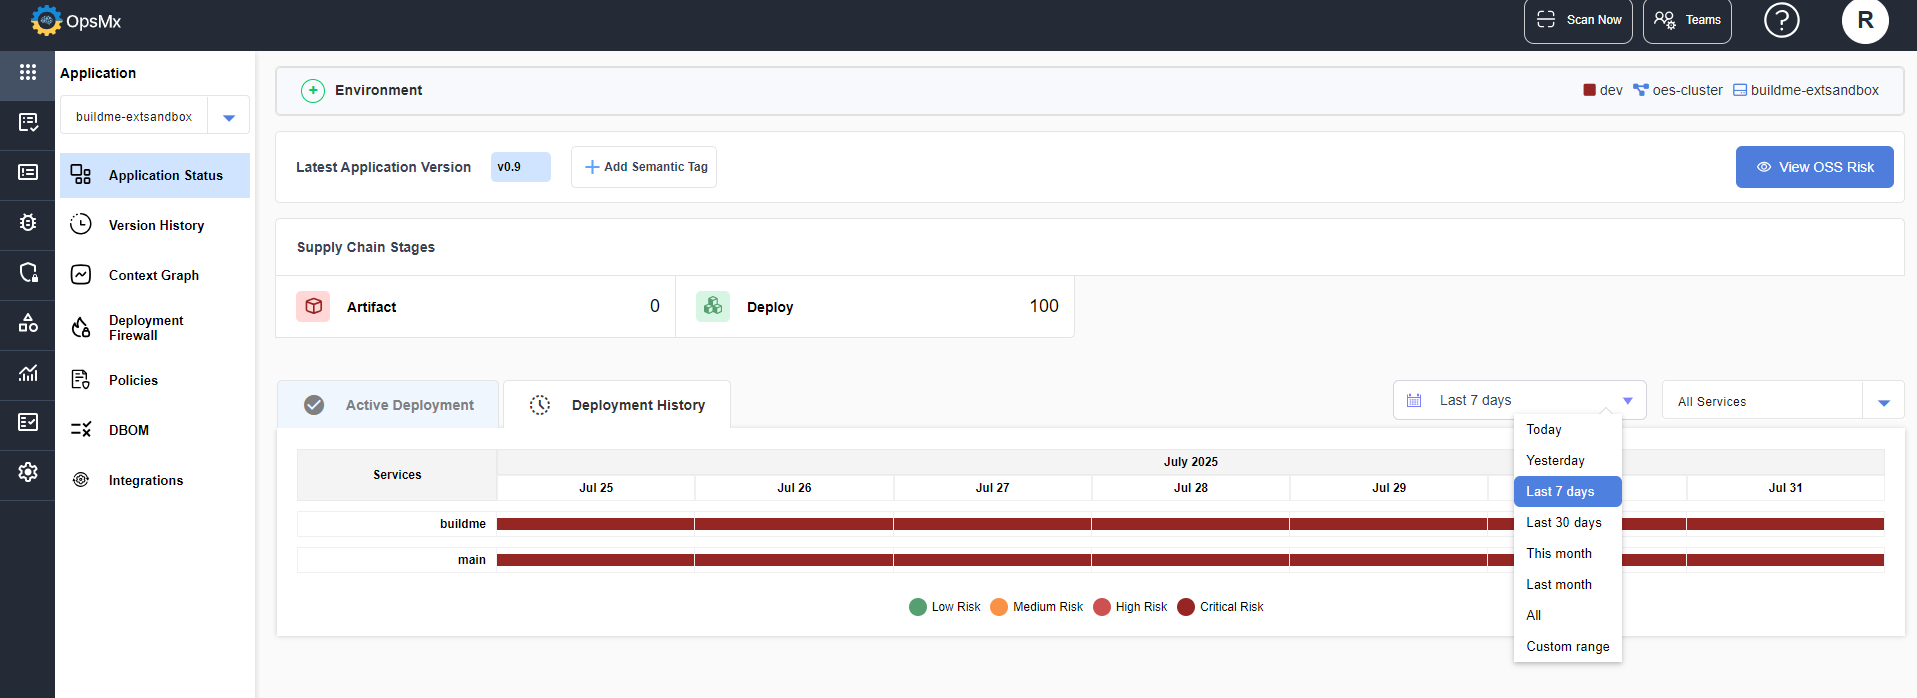
# View Deployment History
The deployment history section is displayed at the bottom of the Application Status page and it displays the deployment data of all the available services in a graphical representation. **Day**, **Week**, and **Month,** wise deployment data can be seen using the **Show Data** **For** filter. The period range for which you want to view the deployments history can also be customized using the **Custom range** option.
### To View Deployment History
* Navigate to **Application Status** > **Deployment History**.
The deployment history section displays the deployments that had occurred for the selected time period. The time period can be **Day View**, **Week View**, **Month View** or you can select **Custom range** and select the specific time period in the calendar displayed.
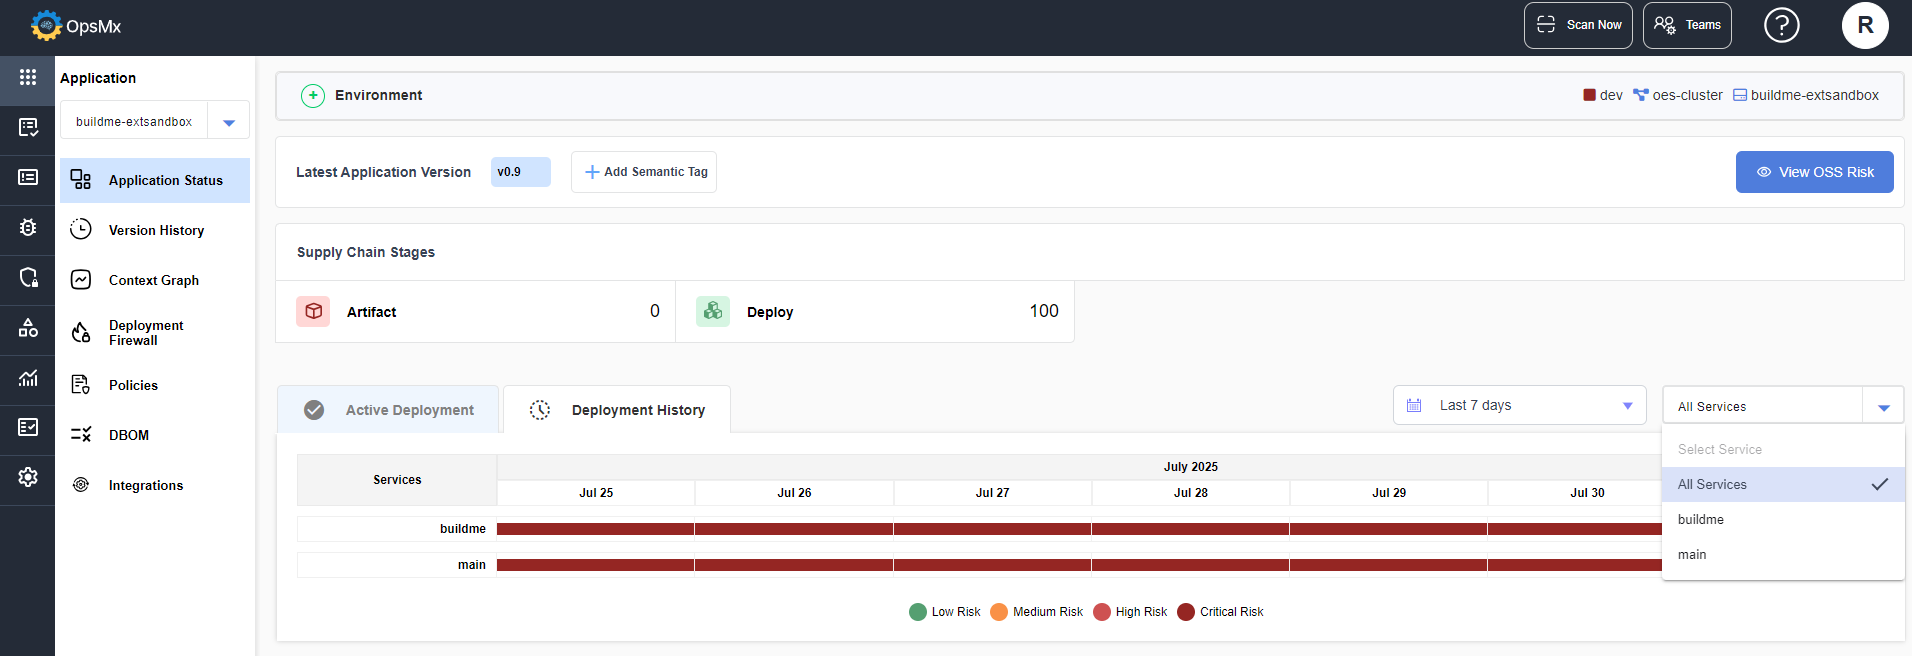
You can also select the Services for which you want to view the deployment history.
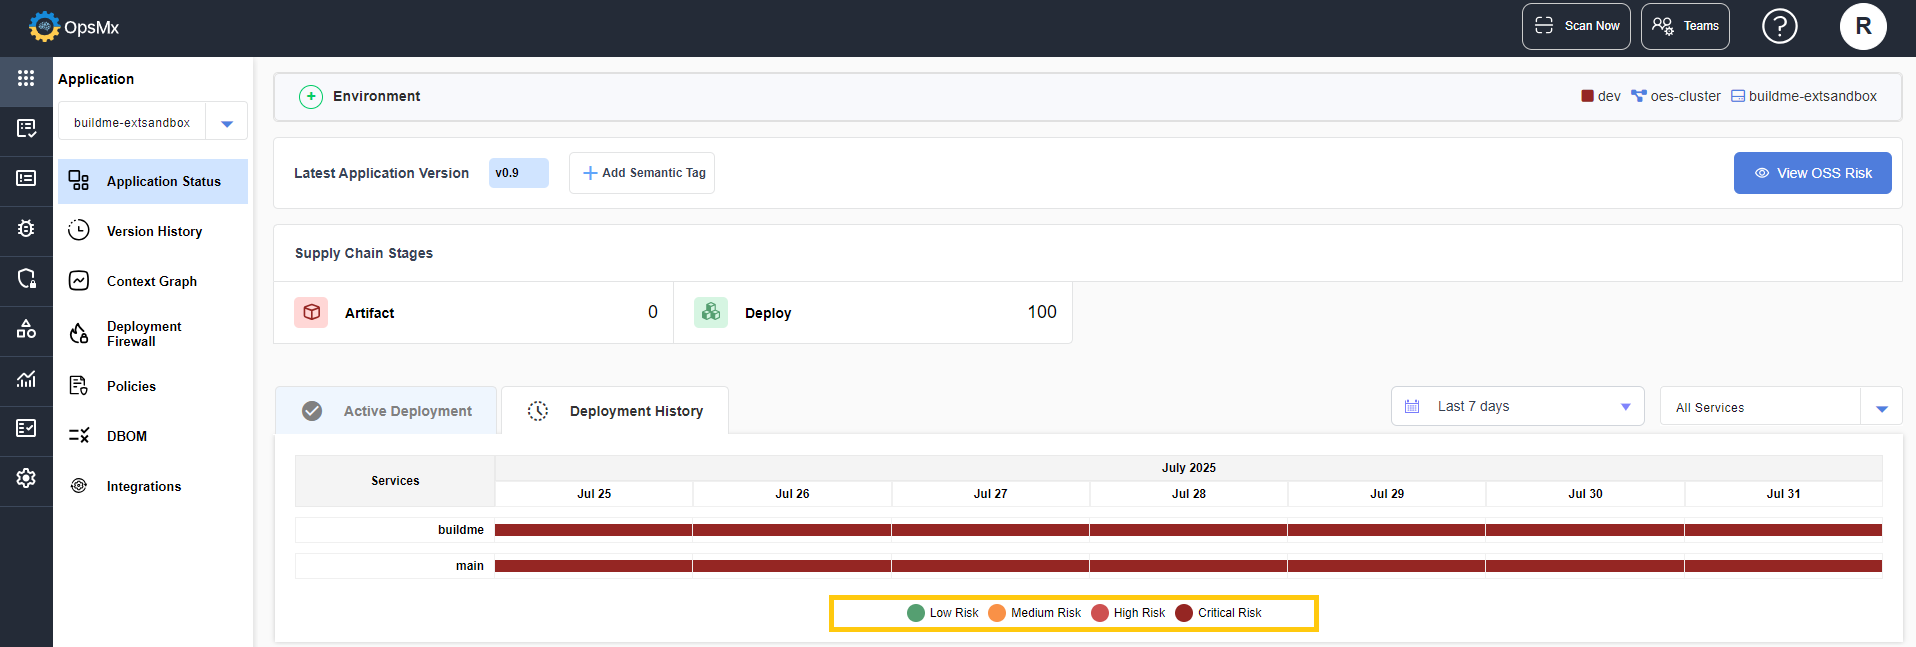
The deployments represented in the data graph are shown in different color codes to indicate the risk levels as shown below:
* **Green** - Low Risk Image
* **Yellow** - Medium Risk Image
* **Pink** - High Risk Image
* **Red** - Critical Risk Image