# OpsMx Active Defense Overview

<table data-card-size="large" data-view="cards"><thead><tr><th></th><th data-type="content-ref"></th></tr></thead><tbody><tr><td><p></p><p>The foundational overview of OpsMx Delivery Shield — what it is, how it works, and how it secures the entire software delivery lifecycle from code to cloud.</p><p></p></td><td><a href="/pages/tLAyCfRJOAVsuhi17Zkl">/pages/tLAyCfRJOAVsuhi17Zkl</a></td></tr><tr><td><p></p><p>AI/ML-driven vulnerability scoring and contextual risk ranking that helps teams focus on what poses the highest real-world threat — not just the longest CVE list.</p><p></p></td><td><a href="/pages/jkUL2zmwyOzgfk3ci5ky">/pages/jkUL2zmwyOzgfk3ci5ky</a></td></tr><tr><td><p></p><p>The complete suite of security scanning capabilities — SAST, SCA, DAST, SBOM, IaC, container, cloud, AI model, and runtime scanning — covering every stage of the delivery lifecycle.</p><p></p></td><td><a href="/pages/m3r3Kl0s32r71zpd5rqF">/pages/m3r3Kl0s32r71zpd5rqF</a></td></tr><tr><td><p></p><p>AI-powered agents that automatically analyze security findings, recommend precise fix actions, and execute remediations — from code fixes and pull requests to cloud misconfiguration corrections.</p><p></p></td><td><a href="/pages/xAmBFgK8RNsJyjN6Do1T">/pages/xAmBFgK8RNsJyjN6Do1T</a></td></tr><tr><td><p></p><p>AI and guided workflows that help developers, security engineers, and operations teams interact with Delivery Shield through natural language, dashboards, and tailored user experiences.</p><p></p></td><td><a href="/pages/SX84xtCPjJyFHGkqojKX">/pages/SX84xtCPjJyFHGkqojKX</a></td></tr><tr><td><p></p><p>Policy enforcement, deployment gating, approval workflows, audit trails, compliance reporting, and exception management — ensuring every release is controlled, traceable, and audit-ready.</p><p></p></td><td><a href="/pages/FE2qDOQOHe2uvEKh275Q">/pages/FE2qDOQOHe2uvEKh275Q</a></td></tr><tr><td><p></p><p>The intelligence backbone of the OpsMx AI platform — continuously ingesting, correlating, and serving contextual data from across the DevSecOps ecosystem to power accurate AI decisions and automation.</p><p></p></td><td><a href="/pages/ImgIcrLJ33whFJLSpU2Q">/pages/ImgIcrLJ33whFJLSpU2Q</a></td></tr><tr><td><p></p><p>Authentication, SSO, RBAC, secrets management, and the configuration of data sources — controlling who can access what across Delivery Shield and where security scan data originates.</p><p></p></td><td><a href="/pages/taIFlPODeZE1Klv6a5Ql">/pages/taIFlPODeZE1Klv6a5Ql</a></td></tr><tr><td><p></p><p>Insights, analytics, and workflow automation that connect security findings, deployment signals, and pipeline data into actionable intelligence — enabling smarter, faster software delivery decisions.</p><p></p></td><td><a href="/pages/1kxsDwA1TVCoHPRSiMGu">/pages/1kxsDwA1TVCoHPRSiMGu</a></td></tr><tr><td><p></p><p>The pre-built connectors to CI/CD tools, source control systems, container registries, cloud platforms, ticketing systems, and security scanners that extend Delivery Shield across your existing toolchain.</p><p></p></td><td><a href="/pages/aM5Ca680kJbjXtSrVS6X">/pages/aM5Ca680kJbjXtSrVS6X</a></td></tr><tr><td><p></p><p>Platform configuration, agent management, user management, team setup, notification settings, and system-level controls for managing Delivery Shield at the organizational level.</p><p></p></td><td><a href="/pages/09lsULWajJtOP5aZfWQd">/pages/09lsULWajJtOP5aZfWQd</a></td></tr></tbody></table>


# Delivery Shield Overview

The rise in software supply chain attacks in recent times has become a critical concern for all organizations. The complexities of modern software delivery pipelines and the ever-evolving threat landscape demands an unified and proactive approach to security, risk management, and governance.&#x20;

As applications, AI skills, agents, first-party code, third-party components, and open-source software move from code to production, new risks, attack surfaces, and attack paths emerge across the lifecycle. OpsMx Delivery Shield is designed to continuously assess, prioritize, and remediate these risks across code, cloud, delivery, and runtime, giving organizations a unified platform to stay secure as systems evolve.

## **What is** Delivery Shield

Delivery Shield provides a comprehensive solution to real-time vulnerability risks and security breaches. Delivery Shield prevents and resolves vulnerabilities and risks in real time, ensuring a secure and compliant software delivery environment. Organizations can confidently deploy software that adheres to highest security.

The inclusion of open-source and third-party components in software development proliferates potential security breaches. The interconnected nature of modern software ecosystems also means a single breach can have long lasting impacts.&#x20;

<figure><img src="https://lh4.googleusercontent.com/Yn-zdYXeBYpmDw0AAM9Sep-V97-t0gUmo6ZgokQnq1HzC8CHsYCNk-neGiBrhejTyFVL_iUK053wtNbcjoEQ69opR_Ldx_Bp1DwNbfy3MIUMez6s--Z3AJtVy_nBEiS9Sm9IOa40WsXGawTslsQbXzM" alt=""><figcaption></figcaption></figure>

This expanding attack surface demands a comprehensive approach to secure every stage of the software supply chain. Delivery Shield records what, how, and where an application is deployed to create a deployment bill of materials (DBOM), the operations equivalent to the development team’s software bill of materials (SBOM). Delivery Shield offers unique features given below that provide  comprehensive visibility over your software delivery and deployment process, enabling compliance, mitigating risks and safeguarding the integrity of your applications.&#x20;

* Deployment firewall enforces application security at the point of deployment, across staging & production environments.
* Deployment Bill of Materials (DBOM – what got deployed, where, and how).
* Automated approvals.
* Compliance Automation automates compliance checks using prebuilt compliance packs such as NIST 800-53, FedRAMP, PCI DSS and HIPPA.
* End-to-End Traceability.
* Vulnerability and security alerts.

### **Delivery Shield Features**

The following are the Delivery Shield features.

* Delivery Shield connects to customers' software delivery tools.
* It automatically synthesizes the current software delivery process from code to cloud and gives a live view of what is running in each environment.
* Generates SBOM for the build artifacts.
* Analyzes and displays the vulnerabilities in the images getting deployed.
* Blocks deployments if it is likely to cause any breach to the security.&#x20;
* Evaluates the software delivery process against a set of secure software delivery policy validations and generates the security posture.
* Continuously monitors the delivery process and generates alerts and suggestions to improve the delivery security posture.
* Generates Delivery Bill of Actions and Materials (DBOM) to attest to an image that it was built, tested and deployed following a secure framework.

### Delivery Shield Key Benefits&#x20;

Delivery Shield offers some key benefits that are listed below:

* **Reduce Risk Exposure** - Prevents security breaches and compliance violations by implementing robust controls and vulnerability management.
* **Greater Visibility and Control** - End-to-end traceability and auditing capabilities giving organizations better visibility and control over their software supply chain.
* **Faster Remediation** - Vulnerability tracking and alerts enabling enterprises to address security issues, reducing potential impact on production swiftly.
* **Seamless Security Integration** - Integrating security processes, teams, and tools within the software delivery environment creates a more comprehensive and cohesive approach to security and compliance.
* **Scalable Security and Compliance** - Ensures continuous security and compliance monitoring even as the organization grows, adapting to changing requirements and new threats while maintaining a robust security posture.
* **Enhanced Efficiency** - Streamline workflows and processes to improve productivity, reduce bottlenecks, and optimize the software delivery lifecycle.


# Key Concepts & Terminologies

## Overview

This page explains the core concepts and terms used throughout the OpsMx Delivery Shield documentation. Understanding these terms will help you navigate the platform confidently — whether you are setting up your first scan, configuring policies, or reviewing compliance reports.

### The Platform

**OpsMx Delivery Shield** OpsMx Delivery Shield is a unified software and AI risk management platform that integrates security scanning, policy enforcement, and governance into software delivery pipelines. It covers every stage of the lifecycle — from source code through to cloud runtime — giving teams a single view of risk across all applications, environments, and tools.

**AI Guardian** The pre-deployment security engine in Delivery Shield. AI Guardian finds vulnerabilities in source code, dependencies, containers, infrastructure, and AI models — and helps teams fix them automatically before anything reaches production. It is the shift-left security layer of the platform.

**Argonaut** The post-deployment operations engine in Delivery Shield. Argonaut monitors deployed applications, diagnoses failures, and guides teams through remediation — directly inside Slack — using AI-powered recommendations and executable commands.

**Gateway** The central control plane of Delivery Shield. The Gateway hosts the dashboard, policy engine, DBOM, reporting layer, and alert management system. It can be OpsMx-managed as a SaaS deployment or self-hosted in your own infrastructure.

**Agent or Delegate** A Kubernetes-based execution engine deployed inside your cluster. The Agent receives scan instructions from the Gateway via gRPC and executes all scans locally — so credentials, source code, and raw scan data never leave your environment. Each connected cluster runs its own Agent.

**Context Engine** The intelligence backbone of the OpsMx AI platform. It continuously ingests, correlates, and serves contextual data from across the DevSecOps ecosystem — grounding every AI recommendation and automated action in accurate, real-time, lifecycle-wide context.

### Security Scanning

**SAST — Static Application Security Testing** A scanning technique that analyzes source code at rest — without running it — to identify security vulnerabilities such as insecure coding patterns, injection risks, hardcoded secrets, and unsafe API usage. In Delivery Shield, SAST is powered by Semgrep, SonarQube, and Opengrep.

**SCA — Software Composition Analysis** A scanning technique that examines open-source libraries and third-party dependencies for known CVEs, outdated packages, and license compliance risks. In Delivery Shield, SCA is powered by Trivy and Grype, with findings matched against the NVD, GitHub Security Advisories, and OSV databases.

**DAST — Dynamic Application Security Testing** A scanning technique that tests running applications from the outside — simulating how an attacker would interact with a deployed service. It finds runtime vulnerabilities invisible to static analysis, such as SQL injection, XSS, authentication flaws, and session management issues. In Delivery Shield, DAST is powered by OWASP ZAP.

**IaC Security — Infrastructure as Code Security** Scanning of infrastructure definition files — Terraform, Kubernetes manifests, Helm charts, Dockerfiles, and CloudFormation templates — for misconfigurations, insecure settings, and policy violations. In Delivery Shield, IaC Security is powered by Trivy and Kubescape.

**CSPM — Cloud Security Posture Management** Continuous monitoring and assessment of cloud infrastructure configurations across AWS, Azure, and GCP — detecting misconfigurations, overly permissive access policies, unencrypted resources, and compliance gaps. In Delivery Shield, CSPM is powered by ScoutSuite and Cloud Custodian.

**Secrets Detection** Scanning of source code, container images, and IaC files for accidentally committed sensitive data — API keys, tokens, passwords, and private certificates. Secrets Detection is integrated into SAST and container image scans within Delivery Shield.

**Container Image Scanning** Security analysis of container images — scanning every layer for OS package vulnerabilities, application dependency CVEs, embedded secrets, and misconfigurations. In Delivery Shield, container image scanning is powered by Trivy and Grype.

**AI Model Scanning** Security analysis of machine learning model artifacts — detecting malware, trojans, poisoned weights, deserialization attacks, and dependency risks embedded in serialized model files such as PyTorch, TensorFlow, ONNX, and Sklearn models. In Delivery Shield, AI model scanning is powered by ModelScan.

### Vulnerability & Risk

**CVE — Common Vulnerabilities and Exposures** The industry-standard identifier for known security vulnerabilities. Each CVE has a unique ID — for example, CVE-2021-44228 (Log4Shell) — and is catalogued in the National Vulnerability Database (NVD) with a severity score.

**CVSS — Common Vulnerability Scoring System** The standardized framework for rating the severity of security vulnerabilities, on a scale from 0 to 10. Scores are grouped into severity bands — Critical (9.0–10.0), High (7.0–8.9), Medium (4.0–6.9), Low (0.1–3.9), and Informational (0).

**CWE — Common Weakness Enumeration** A community-developed list of common software and hardware security weaknesses. Where CVE identifies a specific vulnerability instance, CWE identifies the underlying weakness category — for example, CWE-89 is SQL Injection and CWE-79 is Cross-Site Scripting.

**Exploitability** A measure of how practically accessible a vulnerability is to an attacker in your specific application context. A CVE with a Critical CVSS score but in a library that is never loaded in your production environment has low exploitability. Delivery Shield uses exploitability as a key factor in contextual risk scoring — so teams focus on what is actually dangerous, not just what scores highest on paper.

**Risk Score** An AI/ML-driven score calculated by Delivery Shield that combines CVE severity, exploitability, environment context, business impact, and fix availability into a single, prioritized risk number per finding. Risk Scores help teams focus remediation effort where it matters most.

**Application Security Score** An aggregate score representing the overall security posture of an application — calculated from all open findings across SAST, SCA, DAST, container, IaC, and cloud scans. The score updates automatically as new findings are detected or existing ones are remediated.

**False Positive** A finding that is reported by a scanner but does not represent a real security risk in the specific context of your application. Delivery Shield supports exception management to suppress confirmed false positives — preventing them from repeatedly appearing in reports without discarding the original finding record.

### Policies & Governance

**OPA — Open Policy Agent** The industry-standard policy-as-code engine used by Delivery Shield to define and enforce security and compliance rules. Policies are written in a language called Rego and evaluated automatically at every pipeline gate and deployment event.

**Rego** The policy language used to write OPA rules. Rego policies define what conditions must be true for a deployment to be allowed — for example, no Critical CVEs, no unprotected default branches, or no deployment during a blackout window.

**Rules Genie** An AI feature in Delivery Shield that converts plain-language policy descriptions into executable Rego rules automatically. Security and compliance teams describe what they want to enforce in plain English and Rules Genie generates the corresponding OPA policy — no Rego expertise required.

**Policy-as-Code** The practice of defining security and compliance rules as version-controlled code rather than manual documentation or spreadsheet checklists. Policy-as-code ensures rules are consistently enforced, auditable, and reviewable alongside application code.

**Deployment Firewall** The automated policy gate at the end of the delivery pipeline. The Deployment Firewall evaluates every release against all defined OPA policies and automatically passes, blocks, or escalates a deployment based on the results. It is the last line of defense before code reaches production.

**Blackout Window** A defined time period during which all deployments are automatically blocked — for example, quarter-end dates, maintenance windows, or compliance freeze periods. Blackout Windows are configured as policies in the OPA Policy Engine.

**Approval Gate** A checkpoint in the delivery pipeline that requires explicit human approval before a deployment can proceed. Approval Gates can be configured as mandatory for specific environments — for example, any deployment to production must be approved by a senior engineer.

**Exception** A time-bound, tracked override that allows a deployment to proceed despite a policy violation. Exceptions are logged with the approver identity, reason, and expiry date — and Delivery Shield sends automatic reminders when an exception is approaching its expiry.

**Separation of Duties** A governance control — often required for SOX compliance — that prevents the same person from both approving and executing a deployment. Configured as a policy in Delivery Shield.

### Bills of Materials

**SBOM — Software Bill of Materials** A structured, machine-readable inventory of every component, library, and dependency in an application — including version, origin, license, and known CVEs. Delivery Shield generates SBOMs automatically at the artifact level using Syft and exports them in CycloneDX, SPDX, or JSON format.

**DBOM — Delivery Bill of Materials** An OpsMx concept that goes beyond the SBOM. The DBOM is the end-to-end record of every security check, scan result, policy gate decision, approval, and deployment action from code commit to production. It is the foundation of audit readiness in Delivery Shield.

**MBOM — Model Bill of Materials** An inventory of every component within an AI or ML model — framework, weights, version, origin, license, and CVE status. Generated automatically by ModelScan for every scanned model artifact, in CycloneDX format.

**PBOM — Prompt Bill of Materials** An inventory of every prompt, template, and input configuration used with an AI model — with an associated risk assessment. Used to maintain traceability of AI interactions alongside model and delivery lineage.

**CycloneDX** An industry-standard SBOM format optimized for security use cases — including vulnerability exchange (VEX) and license compliance. Delivery Shield generates and accepts SBOMs in CycloneDX format.

**SPDX — Software Package Data Exchange** An industry-standard SBOM format originally developed by the Linux Foundation — widely used for license compliance and regulatory reporting. Delivery Shield supports SPDX as an export format for SBOMs.

### Infrastructure & Scanning

**ScanConfig CRD** A Kubernetes Custom Resource Definition that stores scan configuration persistently on the Agent cluster — defining what to scan, which scanners to use, and any scheduling or polling settings. ScanConfigs survive Agent restarts and can be managed via kubectl alongside the Delivery Shield dashboard.

**ScanJob CRD** A Kubernetes Custom Resource Definition representing each individual scan execution. A ScanJob is created every time a scan is triggered — tracking its current status, progress, and final outcome. ScanJobs can be inspected directly via kubectl.

**Polling** A scan trigger method where the Agent periodically checks a repository or registry for changes — new commits, tags, or image versions — and automatically triggers a scan when a change is detected. Polling is the recommended alternative to webhooks for environments where inbound network access to the Agent cluster is restricted.

**Webhook** A scan trigger method where the Git provider (GitHub, GitLab, etc.) sends an event to the Agent's Collector service immediately when a push, pull request, or tag event occurs. Webhooks provide the lowest scan latency but require inbound network access to the Agent cluster.

**mTLS — Mutual TLS** A security protocol where both the client and the server authenticate each other using certificates before any data is exchanged. Delivery Shield uses mTLS for all communication between the Gateway and the Agent — preventing unauthorized access or interception.

**gRPC** A high-performance, open-source remote procedure call framework used for communication between the Delivery Shield Gateway and the Agent. All scan configurations and results travel over this gRPC channel, encrypted with mTLS.

### AI & Model Security

**LLM — Large Language Model** An AI model trained on large amounts of text data that can generate, summarize, translate, and reason about text. Examples include GPT-4, Claude, and Llama. Delivery Shield includes specific security controls for LLMs — including adversarial testing via Garak and runtime monitoring.

**Prompt Injection** An attack where adversarial inputs are crafted to redirect or manipulate the behavior of an LLM — causing it to ignore safety guidelines, reveal sensitive data, or execute unintended actions. Garak tests deployed LLMs for prompt injection vulnerabilities.

**MCP — Model Context Protocol** A structured communication framework that enables AI models and agents to interact with external tools, APIs, and data sources. Delivery Shield includes MCP Security controls to govern and audit these interactions — enforcing least-privilege access and detecting context poisoning.

**Jailbreak** An attempt to bypass an LLM's safety constraints or alignment guardrails — making the model produce outputs it was designed to refuse. Garak simulates jailbreak attempts against deployed models as part of adversarial testing.

**Behavioral Drift** An unexpected change in how an AI model responds to inputs — which may indicate that the model has been tampered with, retrained with poisoned data, or is degrading over time. ModelScan and Garak both monitor for behavioral drift in deployed models.


# Compliance Automation

A compliance framework is a structured set of guidelines and best practices designed to help organizations comply with the rules, regulations, and industry standards. It provides a systematic approach to managing and ensuring adherence to various compliance requirements.

Compliance frameworks are essential for organizations to establish effective governance, risk management, and compliance (GRC) programs. These frameworks help businesses identify, assess, and manage risks while ensuring that they operate within the legal and regulatory boundaries applicable to their industry.

OpsMx supports the following compliance frameworks:

* [NIST 800-53](https://docs.opsmx.com/opsmx-secure-software-delivery-ssd-platform/user-guide/compliance-automation/nist-800-53)
* [FedRAMP](https://docs.opsmx.com/opsmx-secure-software-delivery-ssd-platform/user-guide/compliance-automation/fedramp)
* [OpenSSF ScoreCard](https://docs.opsmx.com/opsmx-secure-software-delivery-ssd-platform/user-guide/compliance-automation/openssf-scorecard)
* [OWASP Top 10 CI CD Security Risks](https://docs.opsmx.com/opsmx-secure-software-delivery-ssd-platform/user-guide/compliance-automation/owasp-top-10-ci-cd-security-risks)
* [NSA CISA Top 10](https://docs.opsmx.com/opsmx-secure-software-delivery-ssd-platform/user-guide/compliance-automation/nsa-cisa-top-10)
* [MITRE-ATT\&CK](https://docs.opsmx.com/opsmx-secure-software-delivery-ssd-platform/user-guide/compliance-automation/mitre-att-and-ck)
* [CIS Benchmark Kubernetes](https://docs.opsmx.com/opsmx-secure-software-delivery-ssd-platform/user-guide/compliance-automation/cis-benchmark-kubernetes)


# NIST 800-53

### What is NIST 800-53

NIST 800-53 (SP 800-53) is a publication by the National Institute of Standards and Technology (NIST). It covers various aspects of information security, including access control, incident response, cryptography, configuration management, and more.

### Example of NIST 800-53 policies in Delivery Shield

* **Branch Deletion Prevention Policy** - While the default branch can’t be deleted directly even if the setting is on, in general, it is best practice to prevent branches from being deleted by anyone with write access.
* **Branch Protection Policy** - Repositories should have branch protection enabled requiring all code changes to be reviewed. This means disabling Push events and requiring Pull/Merge Requests to have code reviews.
* **Bot User should not be an Org Owner** - The bot user should not be an organization owner.
* **C-0054 - MITRE - Cluster internal networking** - Exposing a sensitive interface to the internet poses a security risk. Some popular frameworks were not intended to be exposed to the internet, and therefore dont require authentication by default. Thus, exposing them to the internet allows unauthenticated access to a sensitive interface which might enable running code or deploying containers in the cluster by a malicious actor. Examples of such interfaces that were seen exploited include Apache NiFi, Kubeflow, Argo Workflows, Weave Scope, and the Kubernetes dashboard.


# FedRAMP

### What is FedRAMP

The Federal Risk and Authorization Management Program (FedRAMP) is a U.S. government program that standardised the security assessment, authorization, and continuous monitoring processes for cloud products and services. FedRAMP is designed to ensure that cloud services used by federal agencies meet a consistent set of security and privacy standards.&#x20;

This framework, when integrated in Delivery Shield, gets converted to code format. The policies created based on this framework prompts an alert or prevents the deployment if the rule fails.&#x20;

### Example of FedRAMP policies in Delivery Shield

* **Block Container Without Limits** - Requires containers to have memory and CPU limits set and constraints limits to be within the specified maximum values.
* **Block Container Without Request Limit** - Requires containers to have memory and CPU requests set and constraints requests to be within the specified maximum values.
* **Block Undefined Container Ratios** - Sets a maximum ratio for container resource limits to requests.
* **High Vulnerability Prevention Policy** - High Severity Vulnerabilities should not be found in the artifact. &#x20;
* **Low Vulnerability Prevention Policy** - Low Severity Vulnerability should not be found in the artifact.&#x20;

Refer [FedRAMP](https://www.fedramp.gov/documents-templates/) for more information.


# OpenSSF ScoreCard

## OpenSSF ScoreCard

#### What is OpenSSF

Open Source Security Foundation (OpenSSF) is an industry collaboration focused on improving the security of open-source software. The OpenSSF aims to bring together various stakeholders to address security challenges in open-source software and to create resources and initiatives that enhance the overall security posture of the open-source ecosystem.

This framework, when integrated in Delivery Shield, gets converted to code format. The policies created based on this framework prompts an alert or prevents the deployment if the rule fails.

#### Example of OpenSSF policies in Delivery Shield

* **Open SSF Binary Artifacts Policy** - This check determines whether the project has generated executable (binary) artifacts in the source repository.
* **Open SSF CI Tests Policy** - This assesses if the project enforces running tests before merging pull requests, currently applicable only to GitHub-hosted repositories, excluding other source hosting platforms.
* **Open SSF Packaging Policy** - This assesses if the project is released as a package, but only works for GitHub repositories, excluding other source hosting platforms.
* **Open SSF Signed Releases Policy** - This determines if the project cryptographically signs release artefacts.
* **Open SSF Token Permissions Policy** - This Determines Whether the project automated workflow tokens follow the principle of least privilege.

Refer [OpenSSF](https://openssf.org/about/) for more information.

To enable the OpenSSF scan, we need to integrate it with Delivery Shield.

#### To Integrate OpenSSF:

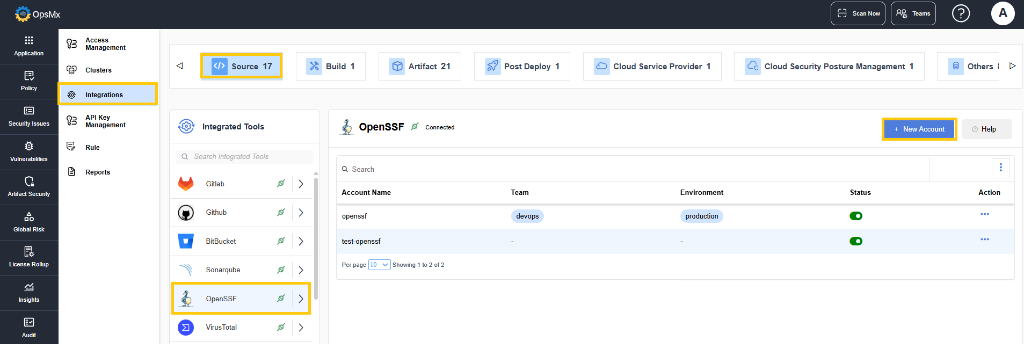
1. Navigate to **Setup** > **Integrations**.
2. In the **Source** panel, click on **OpenSSF**.

<figure><img src="https://files.catbox.moe/zuk4h9.png" alt=""><figcaption></figcaption></figure>

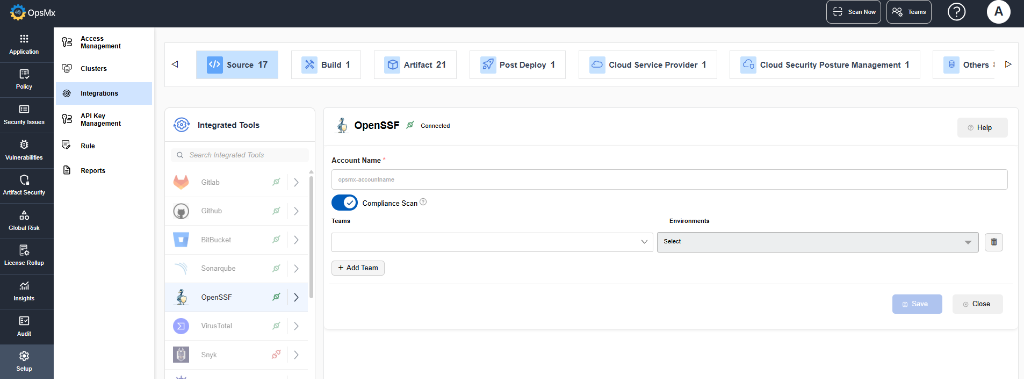
3. The OpenSSF integration page is displayed.

<figure><img src="https://files.catbox.moe/x2b84v.png" alt=""><figcaption></figcaption></figure>

4. Enter the **URL** and **Token** values of your OpenSSF account.
5. Click **Save**. The tool is integrated in the source stage.
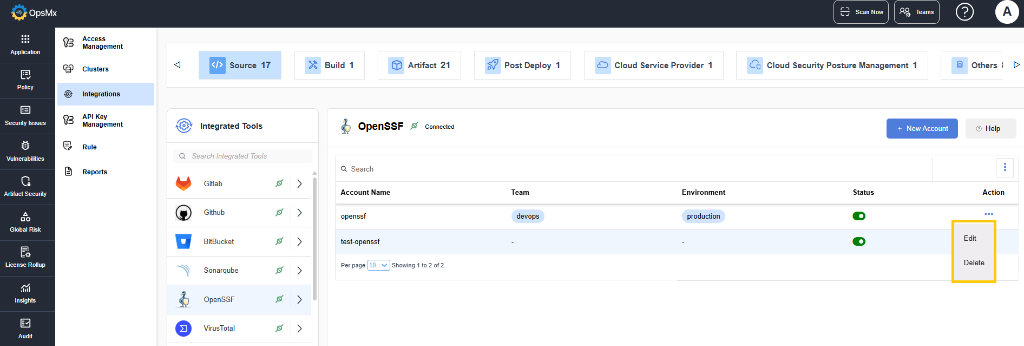
6. You can edit the entered values by clicking the **Edit** option as shown below:

<figure><img src="https://files.catbox.moe/swmr20.png" alt=""><figcaption></figcaption></figure>

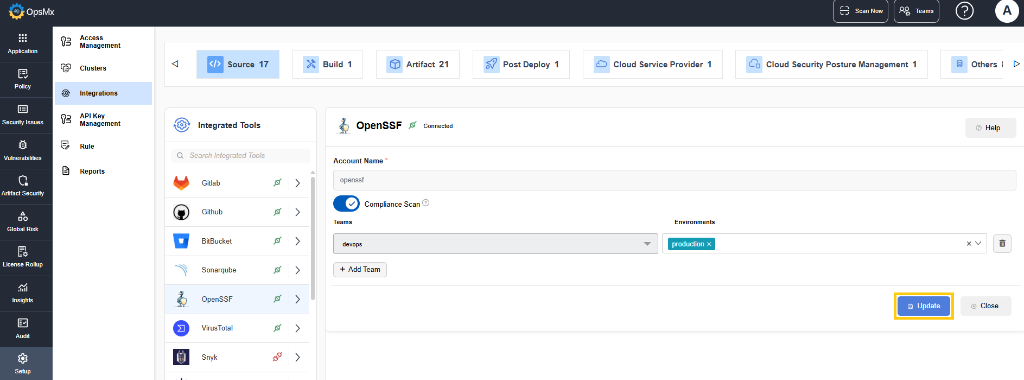
7. Enter the new **URL** and **Token** value and click **Update**. The new values get updated.

<figure><img src="https://files.catbox.moe/6rhx9e.png" alt=""><figcaption></figcaption></figure>

Now the OpenSSF scan can be disabled or enabled.\
\ <br>

<br>


# OWASP Top 10 CI CD Security Risks

### What is OWASP Top 10 CI CD&#x20;

OWASP (Open Web Application Security Project) Top 10 list focuses primarily on web application security risks rather than CI/CD (Continuous Integration/Continuous Deployment) security risks.&#x20;

### Example of OWASP CI CD policies in Delivery Shield

* **Prohibited use of unspecified package versions** - Unspecified Package versions can results in fetching uncertified latest package versions. It should be mandatory to pull only specific version except for latest as artifacts and dependencies.
* **Refrain from running pipelines originating from forked repos** - Repositories should be protected based on 2FA authentication
* **Untrusted Deployment via Configuration Drift** - Pipeline configuration should be fetched only from trusted sources.
* &#x20;**Open to merge public repositories for code utilities** - Dependency packages in code should not be open to merge publically.

Refer [OWASP](https://owasp.org/) for more information.&#x20;


# NSA CISA Top 10

### What is NSA CISA&#x20;

NSA stands for the National Security Agency, while CISA stands for the Cybersecurity and Infrastructure Security Agency. The NSA concentrates on signals intelligence and securing national security systems, while CISA is primarily responsible for enhancing cybersecurity resilience across government and critical infrastructure sectors and coordinating cybersecurity efforts at the national level.

### Example of NSA CISA policies in Delivery Shield

* **C-0068 - NSA - PSP enabled - Pod Security Policies enable fine**- grained authorization of pod creation and updates and it extends authorization beyond RBAC. It is an important to use PSP to control the creation of sensitive pods in your cluster.
* **C-0067 - NSA - Audit logs enabled -** Audit logging is an important security feature in Kubernetes, it enables the operator to track requests to the cluster. It is important to use it so the operator has a record of events happened in Kubernetes.
* **C-0058 - NSA - CVE-2021-25741 -** Using symlink for arbitrary host file system access - A user may be able to create a container with subPath or subPathExpr volume mounts to access files & directories anywhere on the host filesystem. Following Kubernetes versions are affected: v1.22.0 - v1.22.1, v1.21.0 - v1.21.4, v1.20.0 - v1.20.10, version v1.19.14 and lower. This control checks the vulnerable versions and the actual usage of the subPath feature in all Pods in the cluster.

Refer [NSA](https://www.nsa.gov/), [CISA](https://www.cisa.gov/) for more information.&#x20;


# MITRE-ATT\&CK

### What is MITRE-ATT\&CK

MITRE ATT\&CK compliance framework is a standardized set of regulations or requirements that organizations must adhere to. However, MITRE ATT\&CK is widely used as a reference and a framework for improving cybersecurity defences, threat detection, and incident response. Organizations often leverage MITRE ATT\&CK as a tool within broader security and compliance initiatives.

This framework, when integrated in SSD, gets converted to code format. The policies created based on this framework prompts an alert or prevents the deployment if the rule fails.&#x20;

### Example of MITRE-ATT\&CK policies in Delivery Shield

* **C-0067 - MITRE - Audit logs enabled** - Audit logging is an important security feature in Kubernetes, it enables the operator to track requests to the cluster. It is important to use it so the operator has a record of events that happened in Kubernetes.
* **C-0068 - MITRE - PSP enabled** - Pod Security Policies enable fine-grained authorization of pod creation and updates and it extends authorization beyond RBAC. It is important to use PSP to control the creation of sensitive pods in your cluster.
* **C-0069 - MITRE- Disable anonymous access to Kubelet service** - By default, requests to the kubelets HTTPS endpoint that are not rejected by other configured authentication methods are treated as anonymous requests, and given a username of system:anonymous and a group of system:unauthenticated.
* **C-0070 - MITRE - Enforce Kubelet client TLS authentication** - Kubelets are the node level orchestrator in Kubernetes control plane. They are publishing service port 10250 where they accept commands from API servers. Operator must make sure that only the API server is allowed to submit commands to Kubelet. This is done through client certificate verification, and must configure Kubelet with a client CA file to use for this purpose.
* **C-0035 - MITRE - Cluster admin binding** - Role-based access control (RBAC) is a key security feature in Kubernetes. RBAC can restrict the allowed actions of the various identities in the cluster. Cluster-admin is a built-in highly privileged role in Kubernetes. Attackers who have permissions to create bindings and cluster-bindings in the cluster can create a binding to the cluster-admin ClusterRole or to other high privileges roles.&#x20;

Refer [MITRE-ATT\&CK](https://attack.mitre.org/) for more information.&#x20;

<br>


# CIS Benchmark Kubernetes

### What is CIS Benchmark Kubernetes

The Center for Internet Security (CIS) provides benchmarks and best practices for securing various technologies, including Kubernetes. These benchmarks offer guidance on how to configure and manage Kubernetes clusters to enhance their security posture.&#x20;

This framework, when integrated in Delivery Shield, gets converted to code format. The policies created based on this framework prompts an alert or prevents the deployment if the rule fails.&#x20;

### Example of CIS Benchmark Kubernetes policies in Delivery Shield

* **CIS - Compliance Score - Range: 0-30** - Overall CIS Compliance Score found below 30.
* **CIS-1.1.1 Ensure that the API server pod specification file permissions are set to 600 or more restrictive** - The API server pod specification file controls various parameters that set the behaviour of the API server. You should restrict its file permissions to maintain the integrity of the file. The file should be writable by only the administrators on the system.
* **CIS-3.2.1 Ensure that a minimal audit policy is created** - Kubernetes can audit the details of requests made to the API server. The audit policy file flag must be set for this logging to be enabled.
* **CIS-5.3.1 Ensure that the CNI in use supports Network Policies** - Kubernetes network policies are enforced by the CNI plugin in use. As such it is important to ensure that the CNI plugin supports both Ingress and Egress network policies.
* **CIS-5.7.4 The default namespace should not be used** - Resources in a Kubernetes cluster should be segregated by namespace, to allow for security controls to be applied at that level and to make it easier to manage resources.

Refer [CIS Kubernetes Benchmark ](< https://www.cisecurity.org/benchmark/kubernetes>)for more information.&#x20;


# Quick Start Guide

The SSD Scanner CLI is a lightweight tool developed by OpsMx for performing secure software delivery (SSD) scans from customer environments. This page covers system requirements, installation steps and post-installation verification for a quick start with SSD.

### SSD Hybrid Architecture

The SSD solution operates in a hybrid model: scanning runs inside the customer environment, and results are securely transmitted to the central SSD platform.

#### Key Components:

* Customer Environment
* On-prem CLI or CI/CD Webhook initiates scans.
* Targets include applications, container images, and Kubernetes clusters.
* Scan requests and results flow securely to the SSD environment.
* SSD Environment
* Core components: SSD Gate, SSD Service, SSD OPA, Toolchain, Dgraph, and supporting services (RabbitMQ, Temporal, Postgres, MinIO/S3).
* Results and vulnerability data are stored in SSD Vuln DB and SSD OSS DB.
* Communication Path
* The CLI securely connects over HTTPS to the SSD Gate endpoint (e.g., <https://ssd.opsmx.net>).
* No inbound connectivity to customer environments is required.

### System Requirements

| **Category**     | **Requirement**      | **Details**                                       |
| ---------------- | -------------------- | ------------------------------------------------- |
| Operating System | Ubuntu 20.04 / 22.04 | Supported architectures: amd64, arm64             |
| User Access      | Sudo privileges      | Required for package installation and binary copy |
| Disk Space       | ≥ 500 GB             | For CLI and temporary data                        |
| Memory           | ≥ 32 GB              | Recommended: 32 GB or higher                      |
| Dependencies     | curl, sudo           | Installed automatically if missing                |

### Installation Steps

Execute the below command on your Ubuntu VM:

{% code overflow="wrap" %}

```
curl -L -o install_ssd_scanner_cli.sh https://raw.githubusercontent.com/OpsMx/ssd-scanner-cli-public/refs/heads/main/install_ssd_scanner_cli.sh && chmod +x install_ssd_scanner_cli.sh && ./install_ssd_scanner_cli.sh
```

{% endcode %}

This command does the following:

1. Downloads the official installation script from the OpsMx GitHub repository.
2. Installs prerequisites (curl, sudo) if not already present.
3. Detects your system architecture (amd64 or arm64).
4. Downloads the appropriate CLI binary.
5. Copies the binary to `/usr/local/bin`.
6. Verifies that the installation completed successfully.

### Post-Installation Verification

After installation, confirm the CLI is available:

{% code overflow="wrap" %}

```
ssd-scanner-cli --help
```

{% endcode %}

{% hint style="info" %}
Displays all available commands and options.
{% endhint %}

### Connectivity Test

Before performing scans, verify that your environment can reach the SSD endpoint:

{% code overflow="wrap" %}

```
curl -I https://<SSD_URL>
```

{% endcode %}

A `200 OK` or `302 Found` response confirms successful connectivity.

### Troubleshooting

Below are few issues you may face and the resoltion for it:

| **Issue**                        | **Possible Cause**             | **Resolution**                             |
| -------------------------------- | ------------------------------ | ------------------------------------------ |
| curl: (6) Could not resolve host | DNS or firewall block          | Check DNS or whitelist required endpoints  |
| Permission denied                | User lacks sudo                | Run as sudo user                           |
| Failed to download               | GitHub or SSD endpoint blocked | Verify outbound access                     |
| command not found                | Binary not in PATH             | Run sudo cp ssd-scanner-cli /usr/local/bin |


# Installing Delivery Shield

This page provides instructions to install Delivery Shield. Follow the steps provided below to complete the Delivery Shield installation.

## Pre-requisites

Before starting with installation, make sure the following requirements are available and the setup is done as needed:

### Kubernetes Cluster&#x20;

* Kubernetes cluster 1.24 or later with 3 nodes of each 8 CPU cores and 32 GB memory. Execute the below command to check the kubernetes version.

```
kubectl version --short
```

* Helm 3 is setup on the client system with 3.10.3 or later. If helm is not set up, follow instructions provided in[ Installing Helm](https://helm.sh/docs/intro/install/).  Execute the below command to check the helm version.

```
helm version

```

* Kubernetes cluster should support automatic persistent volume provision. If not, configure it manually. For the tool chain we require minimum of 10 Gi. Recommended is 50 Gi. Other services (redis,dgraph,minio,ssd-db) require 8 Gi.

### &#x20;Network Requirements

* Complete internet access is not required, but the following external endpoints must be reachable from the cluster:

```
https://api.first.org/data/v1/epss
https://services.nvd.nist.gov/rest/json/cves/2.0
https://raw.githubusercontent.com/projectdiscovery/nuclei-templates/main/cves.json
https://api.vulncheck.com/v3/index/nist-nvd2
https://api.vulncheck.com/v3/index/vulncheck-kev
http://34.27.35.35:8070
http://212.2.244.234:8900
https://github.com/OpsMx/ssd-policies.git
```

{% hint style="warning" %}
If you have firewall restrictions or use a proxy, make sure these URLs are accessible.
{% endhint %}

### Ingress Controller

* SSD supports:
  * NGINX Ingress Controller
  * AWS Ingress Controller
* Make sure to deploy one of these.

### DNS

* Ensure you have:
  * A valid DNS name (FQDN) pointing to your cluster’s LoadBalancer IP (OR)
  * An updated hosts file.&#x20;
  * Update the below with valid host name(FQDN) or IP address

    `Ip-address SSD.REPLACE.THIS.WITH.YOURCOMPANY.COM`

    `E.g: ssd.opsmx.com`&#x20;

### TLS Certificates

* TLS Certificates are generated using cert-manager.
* Cert-manager must be installable on your cluster.  If not, see[ Cert-Manager](https://cert-manager.io/docs/installation/helm/) for instructions on how to install it.

### Authentication

* Delivery Shield supports:
  * Built-in admin user (username: admin with auto-generated password)
  * SAML (Okta)
  * Google SSO
* If you plan to use SAML (Okta) or Google SSO, make sure your Okta configuration is ready.

### Security Restrictions

* Some proxies (like Cloudflare) can block internal websites. If you use such proxies, please notify SSD Support.

## Installation instructions:

Follow the steps given below for installing Delivery Shield in your environment in the same cluster as the applications:&#x20;

* Clone the repo named enterprise-ssd repo by executing the following command. (please note that the organization name should be changed).

  ```
  git clone https://github.com/OpsMx/enterprise-ssd.git
  ```
* Add opsmx helm repo to your local machine by executing the following command:

  ```
  helm repo add opsmxssd https://opsmx.github.io/enterprise-ssd/
  ```

{% hint style="info" %}
If opsmx-ssd helm repo is already added, do a repo update before installing the chart by executing the following command: `helm repo update`
{% endhint %}

* cd to the enterprise-ssd

  ```
  cd enterprise-ssd/charts/ssd
  ```
* Customize the hosts for various installations using the options in the ssd-minimal-values.yaml under ssdUI. If any other ingress controller is installed, set createIngress flag to false and configure your ingress, see [Ingress-Nginx Controller, ](https://kubernetes.github.io/ingress-nginx/deploy/)for instructions on how to install nginx ingress.&#x20;
* Helm v3 expects the namespace to be present before helm install command is run. If it does not exists, execute the below command:

  ```
  kubectl create namespace opsmx-ssd
  kubectl apply -f https://raw.githubusercontent.com/OpsMx/argocd-ssd/main/job/job.yaml -n <namespace> 
  ```
* The following yamls' are used to install different variations of SSD.&#x20;

| Values yamls            | Description                                                       |
| ----------------------- | ----------------------------------------------------------------- |
| ssd-minimal-values.yaml | This file is used for Installing SSD with default Authentication. |
| ssd-saml-values.yaml    | This file is used for Installing SSD with SAML Authentication.    |
| ssd-local-values.yaml   | This file is used for Installing SSD locally in minikube/K3s.     |

* Update only the host value in the ssd-minimal-values.yaml and namespace value under the kubedetector section (If the namespace value is updated the data will be displayed in SSD).

  **NOTE**: Please read the inline comments of ssd-minimal-values.yaml.
* Install SSD by executing this command:

  ```
  helm install ssd opsmxssd/ssd -f ssd-minimal-values.yaml -n opsmx-ssd --timeout=600s
  ```

## Monitoring the installation process

* Wait for all pods to stabilize (about 2-3 min, depending on your cluster load). The "setup-job" in completed status indicates completion of the installation process.&#x20;

Check the status by executing the following command:

```
$ kubectl -n opsmx-ssd get pods
```

## Checking the installation

* Get the SSD URL using the below command and access in a browser such as Chrome.

  ```
   kubectl -n opsmx-ssd get ingress
  ```
* Fetch the SSD password from the secret using the below command and login to SSD.

  ```
  kubectl -n opsmx-ssd get secret ssd-initial-password -o jsonpath='{.data.ADMIN_PASSWORD}' | base64 -d
  ```
* After logging into the SSD, wait for 5m and the data will be populated.

## Troubleshooting

If you face any issues while installation check the installation logs in debug mode and fix it. In case you are not able to fix the issues feel free to contact [OpsMx support team](https://opsmx.freshdesk.com/support/login).

<br>


# Installing Delivery Shield on VMware

This page provides instructions to install the OpsMx Delivery Shield on a virtual machine hosted on VMware.

### Prerequisites

Before starting with the installation ensure that the following components are already installed in your system:

* VMware Workstation or VMware Player.
* Wget.

### Installation Instructions&#x20;

Follow the steps given below to install Delivery Shield on VMware.&#x20;

#### 1. Download OVF Files from S3 Bucket

Create a new folder and run the below commands from inside the folder to download OVF files from s3 bucket.

```
wget https://ssdvm-2025-05-03.s3.us-east-2.amazonaws.com/SSDVM-disk1.vmdk
wget https://ssdvm-2025-05-03.s3.us-east-2.amazonaws.com/SSDVM-file1.flp
wget https://ssdvm-2025-05-03.s3.us-east-2.amazonaws.com/SSDVM-file2.iso
wget https://ssdvm-2025-05-03.s3.us-east-2.amazonaws.com/SSDVM-file3.iso
wget https://ssdvm-2025-05-03.s3.us-east-2.amazonaws.com/SSDVM.mf
wget https://ssdvm-2025-05-03.s3.us-east-2.amazonaws.com/SSDVM.ovf
```

#### 2. Create VM Using VMware

* Open VMware Workstation or Player.
* Select File > Open.&#x20;
* Navigate to the downloaded path and select the SSDVM.ovf file.
* Follow the prompts to create and configure the virtual machine.

#### 3. Start and Login to the Virtual Machine

* Switch on the VM
* Log in using the credentials shared by OpsMx.&#x20;

#### 4. Run the Delivery Shield Installation Script

* Execute the bootstrap script with the required DNS and Organization name parameters:

```
./opsmxssd/bootstrap.sh <DNS_VALUE> <ORG_NAME>
```

* Replace \<DNS\_VALUE> and \<ORG\_NAME> with the appropriate values provided for your setup.

#### 5. Final Steps

* Wait for the installation to complete.
* Once finished, access the Delivery Shield dashboard in your browser using the DNS value.
* Use the following credentials to log in:
  * Username: admin
  * Password: Printed in the terminal upon script completion.

### Support

For any issues or clarifications during the installation, please contact [OpsMx support team](https://opsmx.freshdesk.com/support/login).

\
\ <br>


# Sending Build and Deployment Events to SSD

This page explains in detail on how to send build metadata, artifact details, and deployment information from an AWS CodeBuild / CodeDeploy pipeline to the SSD (Security, Safety & Delivery) Scanner using API calls. It includes:

* Required AWS environment variables
* Steps to add after pushing images to Artifactory/ECR
* Correct Git URL formatting
* SSD configuration (Teams, Integrators, Tokens)

### Prerequisites

The AWS Pipeline must be able to:

* Build the application
* Push Docker images to Artifactory / ECR

{% hint style="info" %}
If  the data needs to be mapped to a specific team, creating a team is required. Otherwise, this field is optional and can be left empty. Refer [Managing Teams and Access](https://docs.opsmx.com/opsmx-delivery-shield-platform/user-guide/manage-teams-and-access).&#x20;
{% endhint %}

The Bitbucket and ECR integrators needs to be integrated. Refer [Integrating BitBucket](https://docs.opsmx.com/opsmx-delivery-shield-platform/getting-started/integrating-ci-and-cd-tools-in-delivery-shield/bitbucket) and [Integrating ECR](https://docs.opsmx.com/opsmx-delivery-shield-platform/getting-started/integrating-registry-in-delivery-shield/ecr) on steps to complete the process.

### Required AWS Environment Variables

The following environment variables are required in AWS CodeBuild:

| **Variable**     | **Description**                     |
| ---------------- | ----------------------------------- |
| SSD\_URL         | Base URL of the SSD instance        |
| SSD\_TEAM\_TOKEN | API token for team authentication   |
| GIT\_URL         | Repository URL (format shown below) |
| GIT\_BRANCH      | Branch being built                  |
| DOCKER\_IMAGE    | Pushed Docker image name            |
| DOCKER\_TAG      | Tag of the image                    |

#### Mandatory Git URL Format

<https://bitbucket.org/\\>\<ORGANISATION\_NAME>/\<REPO\_NAME>.git

{% hint style="info" %}
If image name/tag variables are already configured in your environment, you can utilize those existing pipeline variables.
{% endhint %}

### Pipeline Step: Sending Build Metadata to SSD

Add the following code immediately after pushing the image to Artifactory/ECR:

```
echo "Sending metadata to SSD Scanner..."

curl --location "${SSD_URL}/webhook/v1/ssd" \
  --header "Content-Type: application/json" \
  --header "X-OpsMx-Auth: ${SSD_TEAM_TOKEN}" \
  --data "{
    \"jobname\": \"${CODEBUILD_BUILD_ID}\",
    \"buildnumber\": \"${CODEBUILD_BUILD_NUMBER}\",
    \"joburl\": \"${CODEBUILD_BUILD_URL}\",
    \"gitcommit\": \"${CODEBUILD_RESOLVED_SOURCE_VERSION}\",
    \"builduser\": \"aws-codebuild\",
    \"giturl\": \"${GIT_URL}\",
    \"gitbranch\": \"${GIT_BRANCH}\",
    \"artifacts\": [
      {
        \"image\": \"${DOCKER_IMAGE}:${DOCKER_TAG}\"
      }
    ]
  }"

```

### Login to ECR & Fetch Artifact SHA

To login to ECR and fetch the artifact SHA execue the below code:

```
aws ecr get-login-password --region AWS.REGION \
  | docker login --username AWS --password-stdin AWS.ACCOUNT.dkr.ecr.REGION.amazonaws.com

echo "Fetching the Artifact SHA..."

ARTIFACT_SHA=$(docker manifest inspect ${DOCKER_IMAGE}:${DOCKER_TAG} --verbose | jq -r .Descriptor.digest)
echo "Artifact SHA: $ARTIFACT_SHA"

echo "Sleeping for 30 seconds..."
sleep 30


```

### Trigger SSD Data Collection (with Retry Logic)

To trigger SSD data collection, execute the following code:

```
echo "Triggering Data Collection API..."

MAX_RETRIES=1000
RETRY_INTERVAL=10
attempt=1

while [ $attempt -le $MAX_RETRIES ]; do
  echo "Attempt #$attempt: Triggering Data Collection..."

  RESPONSE_FILE=$(mktemp)
  HTTP_STATUS=$(curl -s -o "$RESPONSE_FILE" -w "%{http_code}" \
    -X POST "${SSD_URL}/webhook/api/v1/datacollection" \
    -H "Content-Type: application/json" \
    -H "X-OpsMx-Auth: ${SSD_TEAM_TOKEN}" \
    -d "{
      \"artifactName\": \"${DOCKER_IMAGE}\",
      \"artifactTag\": \"${DOCKER_TAG}\",
      \"organizationName\": \"${ORGANISATION_NAME}\",
      \"artifactSha\": \"$ARTIFACT_SHA\"
    }")

  echo "HTTP Status: $HTTP_STATUS"
  cat "$RESPONSE_FILE"

  if [ "$HTTP_STATUS" -eq 200 ]; then
    echo "Data Collection Triggered Successfully."
    break
  fi

  echo "Data Collection Failed. Retrying in $RETRY_INTERVAL seconds..."
  sleep $RETRY_INTERVAL
  attempt=$((attempt + 1))
done

if [ $attempt -gt $MAX_RETRIES ]; then
  echo "Timed out waiting for Data Collection API to return HTTP 200."
  exit 1
fi

```

To retrieve the necessary ORGANISATION\_NAME information from the SSD Dashboard, follow these steps:

1. Go to Setup.
2. Navigate to **Access Management**.

{% hint style="info" %}
This information is required for ORGANISATION\_NAME.
{% endhint %}

### Firewall API (Policy Enforcement Before Deployment)

To access the firewall API execute the following code:

```
echo "Calling the Firewall API..."

RESPONSE=$(curl --silent --location "${SSD_URL}/ssdservice/v1/ssdFirewall" \
  --header "Content-Type: application/json" \
  --header "X-OpsMx-Auth: ${SSD_TEAM_TOKEN}" \
  --data "{
    \"teamName\": \"UPDATE.TEAM.NAME\",
    \"appName\": \"APP.NAME.IN.OPSMX.DASHBOARD\",
    \"account\": \"${BUILD_ENV}\",
    \"clusterName\": \"PROVIDE.ANY.VALUE\",
    \"image\": \"${DOCKER_IMAGE}:${DOCKER_TAG}\"
  }")

echo "Response: $RESPONSE"

ALLOW=$(echo "$RESPONSE" | jq -r '.allow')
PERMISSION=$(echo "$RESPONSE" | jq -r '.proceedWithPermissionCheck')
MESSAGE=$(echo "$RESPONSE" | jq -r '.message')

if [[ "$ALLOW" == "true" && "$PERMISSION" == "true" ]]; then
  echo "✅ SSD Firewall check passed."
else
  echo "$MESSAGE"
  echo "❌ SSD Firewall check failed. Exiting pipeline."
  exit 1
fi
```

| **Field**   | **Description**                       |
| ----------- | ------------------------------------- |
| teamName    | Must match the Team configured in SSD |
| appName     | Application name displayed in SSD UI  |
| account     | Must match name in Clusters page      |
| clusterName | Any user-defined cluster label        |

### Generating a Team Token in SSD

1. Click on the name of the **Team** (given as tabs in the Teams panel) for which you want to generate token as shown below:

<figure><img src="https://docs.opsmx.com/~gitbook/image?url=https%3A%2F%2F2047464521-files.gitbook.io%2F%7E%2Ffiles%2Fv0%2Fb%2Fgitbook-x-prod.appspot.com%2Fo%2Fspaces%252F-MBEa1hoX6SqpDj-ymNs%252Fuploads%252Fr84o8pdF1L8yUfv8X6jJ%252Faccess%2520token%25201.png%3Falt%3Dmedia%26token%3Df8667fcd-45e4-44c5-9cbb-3edbb0b2a735&#x26;width=768&#x26;dpr=4&#x26;quality=100&#x26;sign=4dce077d&#x26;sv=2" alt=""><figcaption></figcaption></figure>

2. The details of the **Team** along with its **User Roles** are displayed.
3. Click **Generate Token** button as shown below:

<figure><img src="https://docs.opsmx.com/~gitbook/image?url=https%3A%2F%2F2047464521-files.gitbook.io%2F%7E%2Ffiles%2Fv0%2Fb%2Fgitbook-x-prod.appspot.com%2Fo%2Fspaces%252F-MBEa1hoX6SqpDj-ymNs%252Fuploads%252Fxi6G8TLs9IodxtCrlcs6%252Faccess%2520token%25202.png%3Falt%3Dmedia%26token%3D9457bc02-a1e3-45e0-b549-ca030b6a85ab&#x26;width=768&#x26;dpr=4&#x26;quality=100&#x26;sign=a3cc75fd&#x26;sv=2" alt=""><figcaption></figcaption></figure>

4. A token is created and a success message is displayed as shown:

<figure><img src="https://docs.opsmx.com/~gitbook/image?url=https%3A%2F%2F2047464521-files.gitbook.io%2F%7E%2Ffiles%2Fv0%2Fb%2Fgitbook-x-prod.appspot.com%2Fo%2Fspaces%252F-MBEa1hoX6SqpDj-ymNs%252Fuploads%252F0u10DYbX0qOXoug69Hyc%252Fimage.png%3Falt%3Dmedia%26token%3D1db6dccd-63a6-4028-a573-e45b1d4ef204&#x26;width=768&#x26;dpr=4&#x26;quality=100&#x26;sign=2e8ed800&#x26;sv=2" alt=""><figcaption></figcaption></figure>

5. Copy & store the token securely

### Points to Remember

* SSD\_URL and SSD\_TEAM\_TOKEN must be defined in AWS CodeBuild environment variables
* Pipeline IAM must allow:
  * ECR authentication
  * Docker manifest inspect
  * External API calls
* After configurations:
  * Re-run the pipeline via AWS console or PR/Push event
  * Wait 5 minutes for SSD Dashboard to update the latest results
  * Ensure there are no errors in the AWS build logs


# SSD APIs

This page provides the list of APIs for SSD:

* [Add Project](https://docs.opsmx.com/opsmx-delivery-shield-platform/ssd-apis/add-project)
* [Update Project](https://docs.opsmx.com/opsmx-delivery-shield-platform/ssd-apis/update-project)
* [Delete Project](https://docs.opsmx.com/opsmx-delivery-shield-platform/ssd-apis/delete-project)
* [Get All Projects](https://docs.opsmx.com/opsmx-delivery-shield-platform/ssd-apis/get-all-projects)
* [Get Project Details](https://docs.opsmx.com/opsmx-delivery-shield-platform/ssd-apis/get-project-details)
* [Get Branch Details](https://docs.opsmx.com/opsmx-delivery-shield-platform/ssd-apis/get-branch-scans)
* [Get Scan Details](https://docs.opsmx.com/opsmx-delivery-shield-platform/ssd-apis/get-scan-details)


# Add Project

This API allows users to add one or more projects for Adhoc scanning.

### Authentication

Addition of project is subject to user roles and permissions.&#x20;

**Method**: Bearer Token or API Key

**Details**: For bearer token header name should be `X-OpsMx-Auth`. API keys can be generated from the SSD UI.&#x20;

### Request Details

#### Endpoint URL

| **Method** | **URL Path**                             |
| ---------- | ---------------------------------------- |
| POST       | {host}/ssdservice/v1/scan/project/upload |

#### Request Headers

| **Header**   | **Description**                 |
| ------------ | ------------------------------- |
| Content-Type | application/json                |
| X-OpsMx-Auth | Bearer Token for authentication |

#### Request Params

| **Header** | **Description**                   | **Comment**                                                                                                                                  |
| ---------- | --------------------------------- | -------------------------------------------------------------------------------------------------------------------------------------------- |
| orgId      | ID of current organisation of ssd | <p><br></p>                                                                                                                                  |
| teamId     | Comma separated teamIds           | The team id will be checked for user permissions. In case user does not have proper  permission to any team, project addition will be denied |

### CURL Example

{% code overflow="wrap" %}

```
curl --location --globoff '{host}/ssdservice/v1/scan/project/upload?orgId=bbcd3005-5a94-4ab8-a42d-449bb11e78a9&teamId=6d226f5a-605d-41d5-8fed-e32e91213b6f' \
--header 'X-OpsMx-Auth: Bearer <token>' \
--header 'Content-Type: application/json' \
--data '[
    {
        "name": "test-git-1",
        "scanType": "sourceScan",
        "platform": "github",
        "accountName": "github-prabhu (stage)",
        "teamName": "stage",
        "scanLevel": "repoLevel",
        "organisation": "PrabhuQA",
        "type": "user",
        "projectConfigs": [
            {
                "repository": "audit-service",
                "scheduleTime": 0,
                "branch": [
                    "onlyMain"
                ],
                "branchPattern": "",
                "scanUpto": 0
            }
        ]
    }
]'
```

{% endcode %}

#### Request Body (JSON)

```
[
    {
        "name": "test-git-1",
        "scanType": "sourceScan",
        "platform": "github",
        "accountName": "github-prabhu (stage)",
        "teamName": "stage",
        "scanLevel": "repoLevel",
        "organisation": "PrabhuQA",
        "type": "user",
        "projectConfigs": [
            {
                "repository": "audit-service",
                "scheduleTime": 0,
                "branch": [
                    "onlyMain"
                ],
                "branchPattern": "",
                "scanUpto": 0
            }
        ]
    }
]
```

#### Request Body (Artifact)

```
[
  {
    "name": "sample-docker-artifact-project",
    "scanType": "artifactScan",
    "platform": "docker",
    "accountName": "test",
    "teamName": "test",
    "scanLevel": "repoLevel",
    "organisation": "opsmx11",
    "type": "",
    "projectConfigs": [
      {
        "repository": "restapp",
        "scheduleTime": 0,
        "tag": [
          "simple-restapp-17412"
        ],
        "tagPattern": "",
        "scanUpto": 0
      }
    ]
  }
]
```

### Response Details

#### Success Response (Status Code: 200/201)

```
{
    "project1": "Succesfully Created!",
    "project2": "Succesfully Created!"
}
```

### Error Responses

| **Status Code** | **Description**                                             | **Example Error Response**            |
| --------------- | ----------------------------------------------------------- | ------------------------------------- |
| 400             | Bad Request (Invalid parameters or missing required fields) | {"error": "Invalid input data."}      |
| 401             | Unauthorized (Missing or invalid authentication token)      | {"error": "Authentication required."} |
| 500             | Some issues in Server                                       | {"error": "Resource not found."}      |

<br>


# Update Project

This API allows users to update the projects.

### Authentication

Project update is subject to user roles and permissions.

**Method**: Bearer Token or API Key

**Details**: For bearer token header name should be `X-OpsMx-Auth.`API keys can be generated from the SSD UI.&#x20;

### Request Details

#### Endpoint URL

| **Method** | **URL Path**                             |
| ---------- | ---------------------------------------- |
| POST       | {host}/ssdservice/v1/scan/project/update |

### Request Headers

| **Header**   | **Description**                 |
| ------------ | ------------------------------- |
| Content-Type | application/json                |
| X-OpsMx-Auth | Bearer Token for authentication |

### Request Params

| Header | Description                       | Comment                                                                                                                                     |
| ------ | --------------------------------- | ------------------------------------------------------------------------------------------------------------------------------------------- |
| orgId  | ID of current organisation of ssd | <p><br></p>                                                                                                                                 |
| teamId | Comma separated teamIds           | The team id will be checked for user permissions. In case user does not have proper permission to any team, project updation will be denied |

#### CURL Example

{% code overflow="wrap" %}

```
curl --location --globoff '{host}/ssdservice/v1/scan/project/update?orgId=bbcd3005-5a94-4ab8-a42d-449bb11e78a9&teamId=6d226f5a-605d-41d5-8fed-e32e91213b6f' \
--header 'X-OpsMx-Auth: Bearer <token>' \
--header 'Content-Type: application/json' \
--data '[
    {
        "name": "test-git-1",
        "scanType": "sourceScan",
        "platform": "github",
        "accountName": "github-prabhu (stage)",
        "teamName": "stage",
        "scanLevel": "repoLevel",
        "organisation": "PrabhuQA",
        "type": "user",
        "projectConfigs": [
            {
                "repository": "audit-service",
                "scheduleTime": 0,
                "branch": [
                    "onlyMain"
                ],
                "branchPattern": "",
                "scanUpto": 0
            }
        ]
    }
]'
```

{% endcode %}

### Request Body (JSON)

```
[
    {
        "name": "test-git-1",
        "scanType": "sourceScan",
        "platform": "github",
        "accountName": "github-prabhu (stage)",
        "teamName": "stage",
        "scanLevel": "repoLevel",
        "organisation": "PrabhuQA",
        "type": "user",
        "projectConfigs": [
            {
                "repository": "audit-service",
                "scheduleTime": 0,
                "branch": [
                    "onlyMain"
                ],
                "branchPattern": "",
                "scanUpto": 0
            }
        ]
    }
]
```

### Request Body (Artifact)

The project is identified using the name field.

```
[
  {
    "name": "sample-docker-artifact-project",
    "scanType": "artifactScan",
    "platform": "docker",
    "accountName": "test",
    "teamName": "test",
    "scanLevel": "repoLevel",
    "organisation": "opsmx11",
    "type": "",
    "projectConfigs": [
      {
        "repository": "restapp",
        "scheduleTime": 0,
        "tag": [
          "simple-restapp-17412"
        ],
        "tagPattern": "",
        "scanUpto": 0
      }
    ]
  }
]

```

### Response Details

#### Success Response (Status Code: 200/201)

```
{
    "project1": "Succesfully Updated!",
    "project2": "Succesfully Updated!"
}
```

### Error Responses

| **Status Code** | **Description**                                             | **Example Error Response**            |
| --------------- | ----------------------------------------------------------- | ------------------------------------- |
| 400             | Bad Request (Invalid parameters or missing required fields) | {"error": "Invalid input data."}      |
| 401             | Unauthorized (Missing or invalid authentication token)      | {"error": "Authentication required."} |
| 500             | Some issues in Server                                       | {"error": "Resource not found."}      |

\ <br>


# Delete Project

This API allows users to delete the projects added for Adhoc scanning.

### Authentication

Deletion of project is subject to user roles and permissions.

**Method**: Bearer Token or API Key

**Details**: For bearer token header name should be `X-OpsMx-Auth` .API keys can be generated from the SSD UI.&#x20;

### Request Details

### Endpoint URL

| **Method** | **URL Path**                             |
| ---------- | ---------------------------------------- |
| POST       | {host}/ssdservice/v1/scan/project/delete |

### Request Headers

| **Header**   | **Description**                 |
| ------------ | ------------------------------- |
| Content-Type | application/json                |
| X-OpsMx-Auth | Bearer Token for authentication |

### Request Params

| Header | Description                       | Comment                                                                                                                                     |
| ------ | --------------------------------- | ------------------------------------------------------------------------------------------------------------------------------------------- |
| orgId  | ID of current organisation of ssd | <p><br></p>                                                                                                                                 |
| teamId | Comma separated teamIds           | The team id will be checked for user permissions. In case user does not have proper permission to any team, project deletion will be denied |

#### CURL Example

{% code overflow="wrap" %}

```
curl --location --globoff '{host}/ssdservice/v1/scan/project/delete?orgId=bbcd3005-5a94-4ab8-a42d-449bb11e78a9&teamId=6d226f5a-605d-41d5-8fed-e32e91213b6f' \
--header 'X-OpsMx-Auth: Bearer <token>' \
--header 'Content-Type: application/json' \
--data '[
    {
        "name": "test-git-1"
    }
]'
```

{% endcode %}

### Request Body (JSON)

```
[
    {
        "name": "test-git-1"
    }
]
```

### Response Details

#### Success Response (Status Code: 200/201)

```
{
    "project1": "Succesfully Deleted!",
    "project2": "Succesfully Deleted!"
}
```

### Error Responses

| **Status Code** | **Description**                                             | **Example Error Response**            |
| --------------- | ----------------------------------------------------------- | ------------------------------------- |
| 400             | Bad Request (Invalid parameters or missing required fields) | {"error": "Invalid input data."}      |
| 401             | Unauthorized (Missing or invalid authentication token)      | {"error": "Authentication required."} |
| 500             | Some issues in Server                                       | {"error": "Resource not found."}      |

\
\ <br>


# Get All Projects

This API allows users to get the details of all the available projects.

### Authentication

Response data is subject to user roles and permissions.

**Method**: Bearer Token or API Key

**Details**: For bearer token header name should be `X-OpsMx-Auth.`API keys can be generated from the SSD UI.&#x20;

### Request Details

### Endpoint URL

| **Method** | **URL Path**                             |
| ---------- | ---------------------------------------- |
| GET        | {host}/ssdservice/v1/{scanType}/projects |

### Request Headers

| **Header**   | **Description**                 |
| ------------ | ------------------------------- |
| Content-Type | application/json                |
| X-OpsMx-Auth | Bearer Token for authentication |

### CURL Example

{% code overflow="wrap" %}

```
curl --location '{host}/gate/ssdservice/v1/{scanType}/projects?teamId=3c5c9dcb-8466-4e06-8ea0-07f9820df897&pageNo=1&pageLimit=10' \
--header 'X-OpsMx-Auth: Bearer <token>'
```

{% endcode %}

### Response Details

#### Success Response (Status Code: 200/201)

{% code overflow="wrap" %}

```
{
  "projectSummaryResponse": [
    {
      "projectId": "0x29ab7",
      "summaryMetaData": {
        "projectName": "test-source-1",
        "platform": "Github",
        "organisation": "OpsMx",
        "status": "Failed",
        "error": "repo: docker-swarm, branch: onlyMain, error: repository OpsMx/docker-swarm does not exist or you do not have access to it"
      }
    },
    {
      "projectId": "0x2645c",
      "summaryMetaData": {
        "projectName": "git1",
        "platform": "Github",
        "organisation": "sriharshakancharla",
        "status": "Completed"
      }
    }
  ],
  "totalSize": 2
}
```

{% endcode %}

### Error Responses

| **Status Code** | **Description**                                             | **Example Error Response**            |
| --------------- | ----------------------------------------------------------- | ------------------------------------- |
| 400             | Bad Request (Invalid parameters or missing required fields) | {"error": "Invalid input data."}      |
| 401             | Unauthorized (Missing or invalid authentication token)      | {"error": "Authentication required."} |
| 500             | Some issues in Server                                       | {"error": "Resource not found."}      |

\
\
\ <br>


# Get Project Details

This API allows users to get to retrieve specific configuration, status, and related data for a given project.

### Authentication

Response data is subject to user roles and permissions.

**Method**: Bearer Token or API Key

**Details**: For bearer token header name should be `X-OpsMx-Auth`. API keys can be generated from the SSD UI.&#x20;

### Request Details

### Endpoint URL

| **Method** | **URL Path**                                         |
| ---------- | ---------------------------------------------------- |
| GET        | {host}/ssdservice/v1/{scanType}/projects/{projectID} |

### Request Headers

| **Header**   | **Description**                 |
| ------------ | ------------------------------- |
| Content-Type | application/json                |
| X-OpsMx-Auth | Bearer Token for authentication |

#### CURL Example

{% code overflow="wrap" %}

```
curl --location '{host}/gate/ssdservice/v1/sourceScan/projects/{projectID}?teamId=3c5c9dcb-8466-4e06-8ea0-07f9820df897&orgId=bbcd3005-5a94-4ab8-a42d-449bb11e78a9' \
--header 'X-OpsMx-Auth: Bearer <token>'
```

{% endcode %}

### Response Details

#### Success Response (Status Code: 200/201)

```
{
    "OpsMx": {
        "docker-swarm": [
            {
                "branch": "main",
                "lastScanDuration": 9.636670818,
                "lastScannedAt": "2025-12-09T06:21:27.441341088Z",
                "triggeredBy": "system",
                "triggerType": "auto",
                "artifactName": "docker-swarm-main",
                "artifactTag": "98394245298c492b5488c9df39fdee209a955610",
                "artifactSha": "sha256:98394245298c492b5488c9df39fdee209a955610",
                "status": "Completed",
                "notificationData": {
                    "alerts": 58
                }
            }
        ]
    }
}
```

### Error Responses

| **Status Code** | **Description**                                             | **Example Error Response**            |
| --------------- | ----------------------------------------------------------- | ------------------------------------- |
| 400             | Bad Request (Invalid parameters or missing required fields) | {"error": "Invalid input data."}      |
| 401             | Unauthorized (Missing or invalid authentication token)      | {"error": "Authentication required."} |
| 500             | Some issues in Server                                       | {"error": "Resource not found."}      |

\
\
\
\
\ <br>


# Get Branch Scans

This API allows users to get the results of a security or code analysis scan on a specific branch within a repository.

### Authentication

Response data is subject to user roles and permissions

**Method**: Bearer Token or API Key

**Details**: For bearer token header name should be `X-OpsMx-Auth`. API keys can be generated from the SSD UI.&#x20;

### Request Details

### Endpoint URL

| **Method** | **URL Path**                                |
| ---------- | ------------------------------------------- |
| GET        | {host}/ssdservice/v1/{scanType}/summarydata |

### Request Headers

| **Header**   | **Description**                 |
| ------------ | ------------------------------- |
| Content-Type | application/json                |
| X-OpsMx-Auth | Bearer Token for authentication |

### CURL Example

{% code overflow="wrap" %}

```
curl --location '{host}/gate/ssdservice/v1/sourceScan/summarydata?repository=docker-swarm&teamId=3c5c9dcb-8466-4e06-8ea0-07f9820df897&projectId=0x29ab7&type=sourceScan&branch=main' \
--header 'X-OpsMx-Auth: Bearer <token>'
```

{% endcode %}

### Response Details

#### Success Response (Status Code: 200/201)

{% code overflow="wrap" %}

```
{
  "scanId": "0x29ab8",
  "branch": "main",
  "headCommit": "98394245298c492b5488c9df39fdee209a955610",
  "lastScanDuration": 9.636670818,
  "lastScannedAt": "2025-12-09T06:21:27.441341088Z",
  "triggeredBy": "system",
  "triggerType": "auto",
  "projectId": "0x29ab7",
  "projectName": "test-source-1",
  "scanTool": "grype",
  "scanType": "sbom",
  "repository": "docker-swarm",
  "scannedFiledData": {
    "OpenSSF": {
      "openssf": {
        "scanName": "openssfscan",
        "scanTool": "Openssf",
        "resultFile": "tool-chain/api/v1/scanResult?fileName=OpsMx_docker-swarm_5610_scorecard.json&scanOperation=openssfscan",
        "status": "Completed",
        "error": ""
      }
    },
    "SAST": {
      "opengrep": {
        "scanName": "opengrepscan",
        "scanTool": "Opengrep",
        "resultFile": "tool-chain/api/v1/scanResult?fileName=findings_OpsMx_docker-swarm_high_5610_opengrep.json&scanOperation=opengrepscan,tool-chain/api/v1/scanResult?fileName=findings_OpsMx_docker-swarm_medium_5610_opengrep.json&scanOperation=opengrepscan,tool-chain/api/v1/scanResult?fileName=findings_OpsMx_docker-swarm_low_5610_opengrep.json&scanOperation=opengrepscan",
        "status": "Completed",
        "error": ""
      }
    },
    "SBOM": {
      "sbom": {
        "scanName": "sbom",
        "scanTool": "Grype",
        "resultFile": "tool-chain/api/v1/scanResult?fileName=sha256-98394245298c492b5488c9df39fdee209a955610-grype.json&scanOperation=sbom",
        "status": "Completed",
        "error": ""
      }
    },
    "SCA": {
      "codelicense": {
        "scanName": "codelicensescan",
        "scanTool": "Trivy",
        "resultFile": "tool-chain/api/v1/scanResult?fileName=OpsMx_docker-swarm_5610_codeLicenseScanResult.json&scanOperation=codelicensescan",
        "status": "Completed",
        "error": ""
      },
      "codesecret": {
        "scanName": "codesecretscan",
        "scanTool": "Trivy",
        "resultFile": "tool-chain/api/v1/scanResult?fileName=OpsMx_docker-swarm_5610_codeScanResult.json&scanOperation=codesecretscan",
        "status": "Completed",
        "error": ""
      }
    }
  },
  "platform": "github",
  "status": "Completed",
  "artifactName": "docker-swarm-main",
  "artifactTag": "98394245298c492b5488c9df39fdee209a955610",
  "artifactSha": "sha256:98394245298c492b5488c9df39fdee209a955610",
  "sbomTool": "grype"
}
```

{% endcode %}

### Error Responses

| **Status Code** | **Description**                                             | **Example Error Response**            |
| --------------- | ----------------------------------------------------------- | ------------------------------------- |
| 400             | Bad Request (Invalid parameters or missing required fields) | {"error": "Invalid input data."}      |
| 401             | Unauthorized (Missing or invalid authentication token)      | {"error": "Authentication required."} |
| 500             | Some issues in Server                                       | {"error": "Resource not found."}      |

\
\
\
\ <br>


# Get Scan Details

This API allows users to retrieve the details of completed or running scans.&#x20;

### Authentication

Response data is subject to user roles and permissions

**Method**: Bearer Token or API Key

**Details**: For bearer token header name should be `X-OpsMx-Auth.`API keys can be generated from the SSD UI.&#x20;

### Request Details

### Endpoint URL

| **Method** | **URL Path**                       |
| ---------- | ---------------------------------- |
| GET        | {host}/ssdservice/v1/scan/filedata |

### Request Headers

| **Header**   | **Description**                 |
| ------------ | ------------------------------- |
| Content-Type | application/json                |
| X-OpsMx-Auth | Bearer Token for authentication |

### CURL Example

{% code overflow="wrap" %}

```
curl --location '{host}/gate/ssdservice/v1/scan/filedata?projectId=0x29ab7&type=sourceScan&scanId=0x29ab8' \
--header 'X-OpsMx-Auth: Bearer <token>'
```

{% endcode %}

### Response Details

#### Success Response (Status Code: 200/201)

{% code overflow="wrap" %}

```
[
    {
        "scanName": "openssf",
        "scanTool": "Openssf",
        "status": "Completed",
        "error": "",
        "metadata": {
            "repoName": "file:///tools/scanResult/unzipped-1525533629",
            "version": "v5.3.0",
            "score": 2.4
        },
        "data": [
            {
                "score": 10,
                "reason": "no binaries found in the repo",
                "name": "Binary-Artifacts",
                "metadata": {
                    "url": "https://github.com/ossf/scorecard/blob/c22063e786c11f9dd714d777a687ff7c4599b600/docs/checks.md#binary-artifacts",
                    "short": "Determines if the project has generated executable (binary) artifacts in the source repository."
                }
            }
        ]
    }
]
```

{% endcode %}

#### Error Responses

| **Status Code** | **Description**                                             | **Example Error Response**            |
| --------------- | ----------------------------------------------------------- | ------------------------------------- |
| 400             | Bad Request (Invalid parameters or missing required fields) | {"error": "Invalid input data."}      |
| 401             | Unauthorized (Missing or invalid authentication token)      | {"error": "Authentication required."} |
| 500             | Some issues in Server                                       | {"error": "Resource not found."}      |

\
\
\
\ <br>


# Release Notes

### Introduction

Software supply chain attacks are on the rise and have become a critical concern for all organizations. The modern software delivery pipelines have become increasingly complex, and the threat landscape is continuously evolving. Therefore, a unified and proactive approach to security, risk management, and governance across the software delivery lifecycle is essential.&#x20;

OpsMx Delivery Shield is a solution that focuses on monitoring, alerting, preventing, and resolving security threats and vulnerabilities across the software delivery lifecycle. It seamlessly integrates with your DevOps ecosystem to gather and evaluate information against a set of secure software delivery practices and frameworks. This ensures that insecure application versions do not get released. The solution also keeps track of all actions, people, and process metadata related to software development, thereby enabling enterprises to meet their compliance requirements with ease.

### Version 2026.06.00

### Features:

* **NLI Integration in SSD** - NLI (Natural Language Interface) is integrated into SSD. The OpsMx Assistant feature uses the natural-language interface to investigate risks, understand context, and trigger remediation workflows without navigating multiple tools and dashboards.
* **AI-Powered CSPM Remediation in SSD** - Delivery Shield now integrates CSPM (Cloud Security Posture Management) remediation into SSD, letting teams detect cloud security misconfigurations and generate automated fixes for them — directly from the findings, without switching to external cloud consoles or separate remediation tools.
* **Binary Remediation** - Binary Remediation is added in Adhoc Scanning. This feature covers vulnerability detection and remediation for binary/container images within the SSD platform, scanning Docker images for OS-level, runtime, and binary vulnerabilities to help teams identify and remediate issues directly from image scan results. &#x20;
* **Code Remediation Support for Bitbucket Repositories** - Delivery Shield now extends code remediation capabilities to Bitbucket repositories, in addition to existing GitHub support. This lets teams identify SAST findings and apply AI-assisted fixes directly for code hosted on Bitbucket, the remediation workflow.
* **Code-level reachability analysis for Vulnerabilities** - Delivery Shield now includes reachability analysis, which checks whether vulnerable components are actually invoked in your application code. This helps distinguish exploitable (reachable) vulnerabilities from non-exploitable (non-reachable) ones, improving prioritization accuracy and reducing false positives in vulnerability reports.
* **Checkmarx Integration** - Delivery Shield now supports integration with Checkmarx to automatically ingest SBOMs generated for your applications. Once uploaded into SSD, these SBOMs are available for further analysis, reporting, and vulnerability insights — streamlining visibility across tools without manual upload.&#x20;
* **AIBOM Support** - Delivery Shield now supports AIBOM (AI Bill of Materials), providing a structured inventory of AI/ML assets including models, datasets, and training metadata. This gives teams visibility into AI components, their dependencies, and lifecycle details — including versioning — while capturing all mandatory metadata fields in alignment with CERT-In technical guidelines for governance and compliance tracking.
* **Report Subscription** - A new feature named Report Subscription is configured in SSD to automate report triggers, manage delivery schedules, and track upcoming compliance report runs. The reports can be configured and sent through email.&#x20;

### Enhancements

* A new field is added in the JIRA integration to create separate Jira tickets based on the severity level of the vulnerabilities. This helps to efficiently manage and triage large volumes of security vulnerabilities.&#x20;
* A new toggle button named Latest Scans is added to the Artifact Scan page. On enabling this, the latest or recent scans only will be displayed.&#x20;

### Bug Fixes

* Adhoc source scans for Bitbucket repositories now list all available branches correctly (previously only 10 branches were listed at a time).
* Open security issues count now displays properly at the Artifact level (previously shown missing/blank despite data being present in the detail view).&#x20;
* The issue where re-triggering scans via the Rescan option on the Adhoc page failed after switching the scan tool from Trivy to Syft is fixed.&#x20;
* Alerts are added for scans stuck in the temporal queue for extended periods, so delays are identified proactively instead of relying on customer reports.&#x20;

### Version 2026.05.00

### Features:

* **Support for Mobile Application (APK/IPA) upload in DAST** - The API DAST scanner now supports the upload and scanning of mobile application packages, including APK (Android) and IPA (iOS) files, enabling comprehensive security assessments of mobile applications within the platform.&#x20;
* **QBOM Implementation** - QBOM (Quantum Bill of Materials) reporting is introduced to help organizations create inventory cryptographic assets and assess their exposure to quantum computing risks. The report identifies cryptographic algorithms and dependencies, highlights quantum-vulnerable algorithms, tracks the use of post-quantum cryptography, and captures mandatory metadata required for CERT-In compliance.
* **SBOM to SBOM Comparison** - A new SBOM comparison option is added to the Artifact page, enabling users to compare two SBOM files of the same application. This helps identify changes in dependencies, versions, and associated vulnerabilities across software releases.&#x20;

### Enhancements

* CBOM scanning support is extended to additional programming languages and frameworks, including C/C++, Kotlin, Flutter, and Node.js.&#x20;
* Support is added to integrate scan results into CI/CD pipelines, enabling a consolidated summary of vulnerabilities, compliance status, and overall scan findings to be displayed upon build completion. This enhancement improves visibility during build and release stages while seamlessly integrating security insights into existing DevSecOps workflows.&#x20;
* The DAST engine is enhanced to support advanced security testing scenarios, including business logic validation, multi-step attack simulations, and comprehensive authentication and authorization testing. These improvements help identify complex application vulnerabilities and provide deeper security assessment coverage.
* CBOM capabilities are enhanced to align with CERT-In compliance requirements by capturing required cryptographic metadata and improving component mapping. Support is added to detect weak or deprecated cryptographic algorithms such as MD5, SHA-1, DES, and RSA-1024, along with remediation recommendations for stronger alternatives. Compliance findings are now surfaced in CBOM reports and dashboards, enabling better cryptographic risk visibility and regulatory tracking.

  &#x20;

### Version 2026.04.00

### Features:

* **Support for Postman Collection (JSON) in API DAST Scanner** - The API DAST scanner now supports Postman Collection (JSON) files as a direct input option for API security scanning. This enhancement eliminates the need to manually convert Postman Collections to OpenAPI Specification (OAS) format, streamlining scan configuration and improving workflow efficiency.
* **SBOM page Improvements** - The following enhancements have been made to the SBOM page:
  * Each component provides a drill-down view that displays its dependencies of dependencies along with the corresponding vulnerability details.&#x20;
  * Added support for downloading SBOM files in SPDX format.
  * Added the ability to download VEX (Vulnerability Exploitability eXchange) reports.
  * Added detection and display of the programming language associated with scanned components, providing better visibility into application composition.
* **AMI Scan Artifact**- A new AMI Scan Artifact page is added under the Artifact Security section. This feature enables users to scan Amazon Machine Images (AMIs) stored in Amazon S3 buckets and generate a Software Bill of Materials (SBOM) for managed AWS EC2 instances.&#x20;
* **Support for Exception Handling at Org Level** - Support is now available for defining component-level and alert-level exceptions at the organization level. Previously, exceptions could only be configured at team levels.

### Enhancements

* Support for downloading DAST Scan results in CSV format has been added, and also reports can now be generated in HTML format.&#x20;
* Integration of CDXGEN tool into CLI-based SBOM scanning has been added to enhance the scanning process.&#x20;

### Bug Fixes

* The downloaded JSON files now include appropriate suffixes, making it easier to differentiate the file types.&#x20;
* Incorrect open issues count displayed in the Artifact page is fixed.&#x20;
* The issue where the Go To Artifact Page action redirected users to an incorrect page instead of the corresponding artifact page is fixed.&#x20;
* The issues affecting the functionality of the View SBOM and Back buttons on the SBOM page have been resolved.&#x20;
* The error that was displayed during the download of VEX reports from the SBOM Report page is fixed. &#x20;
* The download issue while downloading the .json & .csv files in the SBOM page is fixed.

### Version 2026.03.00

### Features:

* **Adhoc Terraform Scanning Support** - The application is enhanced to support Adhoc Terraform scans for the AIG Terraform Remediation feature. Previously, Terraform vulnerability scanning in OpsMx Delivery Shield (SSD) was supported only during application deployment events as part of the CD lifecycle. With this enhancement, external systems such as AIG can now trigger Terraform scans on demand, independent of deployment pipelines, and retrieve vulnerability data to automatically generate remediation patches.
* **Custom Permission option for Users** - The application is enhanced with a custom permission-based RBAC system that allows administrators to either provide full administrative access or assign specific permissions to users based on functional areas. Based on the assigned permissions, the UI automatically enables or restricts actions such as buttons, controls, and operations. The same permission validation is also enforced at the API level to ensure secure and consistent access control across the platform.

### Enhancements

* The application is enhanced to automatically detect configuration updates and apply them without requiring pod restarts, improving operational efficiency and minimizing service disruption.
* The CLI artifact handling is corrected by aligning artifact details with preprocessor handling for non-image artifacts, enabling the event pipeline to correctly detect and process SBOMs generated through the CLI workflow.
* The SSD-GATE service is enhanced to support API authentication using user tokens in addition to organization-level tokens.&#x20;
* Exception handling is enhanced by adding support for configuring exceptions at both the component level and alert level within projects, enabling more granular and flexible exception management.

### Bug Fixes

* Display of blank page instead of the configuration page, in the **Edit Configuration** page of **IAC Scan** product detail page is fixed.
* The “No data found” error in the Tfsec scan section, even when one alert related to a source rule was present in the grid, is resolved.
* The issue where alert counts for the same artifact were inconsistently reflected across different teams after scan completion has been fixed.
* Exceptions can now be raised again after being revoked.
* The alerts are now displayed in the Tfsec section.&#x20;
* The issue where applying custom permissions caused the Dashboard, Policy, and Clusters pages to appear blank, while the Integration page remained stuck in a loading state, is resolved.&#x20;
* The issue where the Scanner CLI analysis workflow completed successfully, but the Tfsec section incorrectly displayed a failed status is fixed.&#x20;
* The issue where the IAC Scan Integration page appeared blank and remained in a continuous loading state is resolved.
* The Bulk Update functionality in the Project Level Policy is working now.

### Version 2026.02.00

### Features:

* **Slack and Email Alerts for User and Scan Activities** - Slack and Email integrations can be configured to send notifications to the appropriate channels and users through messages and emails. This is implemented for audit activities, to notify about open issues and blocked alerts after the completion of an ad-hoc scan.
* **Support for Policy Enforcement at Project Level** - Policies can be enforced at the project level, so that users can apply prevent/allow/block policies with fine granularity and meet enterprise governance needs.
* **Remediation Integration in Scan Now option** - Automated workflow is integrated into Scan Now, enabling security vulnerabilities identified by OpsMx Delivery Shield (DS) during the Software Development Life Cycle (SDLC) to be automatically routed to OpsMx AI Guardian (AIG) for remediation. This integration focuses on code-level fixes for Static Application Security Testing (SAST) and Software Composition Analysis (SCA) findings in supported languages such as Java and Go, helping accelerate the Mean Time to Remediate (MTTR).

### Enhancements:

* Scan Now is enhanced to support scheduled rescans of projects. The scan interval can be configured in the settings. This ensures that artifacts from ad-hoc scans are periodically reanalyzed to detect newly identified vulnerabilities or exceptions.
* Impacted Artifacts and Vulnerabilities pages are now accessible from the Policy page, displaying results based on the selected policy.
* Added support for scanning private repositories in Quay, in addition to public repositories.
* The count of security issues (open and blocked) identified in an artifact is now included in the audit message after data collection is completed.
* Policy execution activities are now visible on the Audit Center page.
* Project status is enhanced to reflect the combined status of all configurations associated with the project.
* The Vulnerability Details page is enhanced to display all the available fix versions of the vulnerabilities in ascending order.
* The Active Exceptions page is enhanced to display the component version alongside the vulnerability version when uploading a list of vulnerabilities.

### Version 2026.01.00

### Features:

* **Support for RDS** - Support for Amazon Relational Database Service (RDS) is added to CSPM scans as part of effective scanning. This integration is functional within Scout Suite and the context graph will reflect the addition of RDS support.
* **Scanning different folders as scan targets in Monorepos** - A new input is introduced to allow adhoc scanning of separate folders within the Github repository to reduce performance impact and execution time by avoiding full repository scans and instead limiting the scan to only the user-specified folder. This will also help minimize resource usage (cloning time, storage, and processing overhead) when dealing with large repositories.
* **Accessibility of SonarQube and OpsMx Reports** - Users can now access both SonarQube and OpsMx reports at the same platform without navigating between platforms.&#x20;
* **Support for JIRA Integration at Scan Target Level** - Support for JIRA integration at the scan target level, along with ad-hoc projects mapped to distinct JIRA components. This improved alignment between scan results and JIRA workflows.
* **Support for JIRA integration at Service Level** - Support is added for JIRA integration available at the service level within an application. An additional RBAC (Role-Based Access Control) layer is added to control access and permissions for integrations.  \
  For the Application Integrator, a new service selection option will be added. This allows users to choose specific services within an application where JIRA integration should be enabled.

### Enhancements:

* The following improvements are done in the CSPM page.
  * Redirection from Cloud Security to the CSPM Analysis page is added to provide more visibility to customers.
  * Downloading the page details in the form of CSV,JSON format is added.
  * Ability to download all the CSPM alerts/issues at a time for different projects.
  * Option to select the Artifact from the CSPM Page.
  * Preset of remediation for all the CSPM Alerts.
  * Propagating the filters while downloading reports from the CSPM page.
* Allow multiple service URLs for the ZAP integrator when the authentication details are the same across all services. Also, added support for multiple service URLs in ad-hoc DAST scans.
* Support local users authentication alongside SSO/SAML, to help the customer bootstrap and as a safety net for accessing the data.
* The location details are added for the vulnerable components identified during all the scan methods.&#x20;

### Bug Fixes:

* The missing location details for vulnerabilities coming from indirect/transitive dependencies is addressed.
* The incorrect status display in the Application and DBOM pages are fixed.

### Version 2025.12.00

### Features:

* **Robot account Support for Quay** - Quay registry integration is implemented with support for Robot Account authentication using Basic Authentication. This integration enables secure access to Quay repositories for operations such as fetching image metadata, tags, and manifest details, and supports scanning of public container images from Quay registries.
* **Enabling Scan Completion Notifications** - Email notifications are implemented to automatically trigger notifications to the user upon completion of each scan.
* **Continuous Scanning of SBOM** - The continuous SBOM scanning and delta highlighting are implemented on the Artifact Management page. Sorting by First Seen Date is also added, enabling customers to track deployed assets and identify when patches need to be released for shipped software.
* **Support for ECS (Amazon Elastic Container Service) in the CSPM reachability Scan** - Support for Amazon ECS resources is added to the CSPM scans. This feature enables accurate assessment of ECS resources to identify the security vulnerabilities and misconfigurations.

### Enhancements

* Model Scan Audit is enhanced to include activities such as Project analysis started, Project failed, repository-level scan errors, Model Scan, and Garak/NBDF error scenarios.
* The risk scoring algorithm for Open Source Software (OSS) components is updated to evaluate security risk based on open (unpatched) vulnerabilities and apply score-based promotion for appropriate severity classification.
* The consolidated report on the OSS page is enhanced to include the list of all licenses detected at both the application and enterprise levels.
* Model Scan is enhanced to capture error handling and status updates for ad hoc scan results.
* A scroll bar is added to the Context Graph Map page to improve navigation.
* The refactor prioritization algorithm is improved to better reflect exploitability data by reducing reliance on network reachability and introducing new exploitability metrics.
* The User Audit page is enhanced to improve the audit flow and monitor additional scanning activities.

### Bug Fixes

* The issue in vulnerability scans where the fixed version appeared older than the installed version for certain vulnerabilities is fixed.
* The incorrect status display of security policies is fixed.
* The DBOM version filter issue is fixed.
* The issue where the Context Graph did not display data for some applications is fixed.
* The issue where non-image pipeline applications were not visible under the Applications tab is fixed.
* The inconsistent expand/collapse behavior in the left-side navigation menu is fixed.
* The issue where historical data was missing on the Vulnerabilities page for scanned applications is fixed.
* The slow loading time of the Application, Security Issues, and Vulnerabilities pages is fixed.
* The base image used for the SSD UI is updated.

### Version 2025.11.00

### Features:

* **Licenses tab in SBOM pages** - A new tab named Licenses is added in the SBOM pages. Cumulative licenses details of all the components can be downloaded using this tab.
* **New page in SSD** - A new page named **Rule** is added to SSD, that shows all available rules from these third-party tools (Trivy, OpenSSF, Semgrep, Opengrep, Snyk, SonarQube, Kubescape, ZAP) that are available in the SSD. It also provides users with the ability to configure SSD so that alerts are not generated for specific rules.
* **AI Model Scan** - The AI Model scan option is added as part of the Adhoc scan. The ability to scan AI/ML Models published on HuggingFace using NBDefence and Garak tools is added as part of this scan option.
* **SSD Firewall CLI for Offline Policy Evaluation** - A CLI tool that evaluates security scan results against OPA policies without requiring database or service dependencies is added. This enables the teams to enforce security policies in the CI/CD pipelines, air-gapped environments, and local development without connecting to the SSD platform backend.&#x20;

&#x20;       **Key Features**

* The key features include:
  * Evaluate vulnerability scans from Trivy, Grype, Syft (CycloneDX format).
  * Validate Kubernetes manifests for pod security compliance.
  * Load policies dynamically from bundles with local caching.
  * Support multiple output formats (console, JSON, SSD platform format).
* **CDXGen Integration in SSD** - The CDXGen tool is integrated as part of the SBOM tool in SSD for generating more comprehensive and accurate SBOMs directly from source code.&#x20;
* **New APIs and Alerting Automation Support** - New APIs are added to enable automated login instead of token based authentication, to delete and edit projects, and send slack notifications when ad hoc scanning fails.

### Enhancements

* GCS support is added in the Mobile Scan option.
* Improvements are done to the downloadable summary reports in the OSS Risk, Security Issues, and SBOM pages.
* Improvements have been done to the User Audit page to enhance the audit flow and monitor more scanning activities.

### Bug Fixes

* Critical and high-severity vulnerabilities detected by the latest security scans or dependency analysis tools in UI are fixed.

## Version 2025.09.00

### Features:

* **Mobile Scan Feature** - The Mobile Artifact Scan Feature introduces comprehensive security scanning for mobile application artifacts stored in repositories. This feature supports the analysis of Android (APK), iOS (IPA), and other mobile package formats to verify artifact integrity, security, and compliance. It helps identify vulnerabilities and ensures that only trusted and compliant mobile artifacts progress through the development and release pipelines.
* **User Audit Page** - The User Audit Page consolidates audit information from multiple SSD services to provide enhanced visibility into user activities. In this release, the page displays User Login Activity data, offering administrators a centralized view of access patterns and actions.&#x20;
* **Grouping of Slack Alerts** - The Slack notification mechanism through the Slack integrator has been enhanced when the Auto Trigger option is enabled. Previously, a separate notification was sent for each vulnerability detected after a scan. With this update, vulnerabilities are now grouped based on their severity levels, and one or two consolidated notifications are sent. This reduces message frequency and improves clarity in communication.
* **Summary Reports in various pages** - Downloadable summary reports have been introduced on the OSS Risk, Security Issues, and SBOM pages. These reports provide a detailed overview of key parameters and metrics available on each page and can be exported in PDF format.
* **Vulnerability Prioritization Algorithm** - The Vulnerability Prioritization Algorithm has been enhanced to deliver more precise and actionable insights. The updated model now leverages a weighted combination of key data points, along with improved weighting factors, calculation methodology, output scoring, and severity mapping. These improvements support more effective resource allocation by enabling teams to focus on the most critical vulnerabilities for remediation.
* **JetBrains IDE Plugin for SSD** - The JetBrains IDE plugin has been added to SSD, providing developers with the ability to perform in-IDE security scans using Trivy, OpenSSF, and Semgrep. The plugin automatically generates detailed reports based on scan results, allowing developers to identify and remediate issues early in the development process. This integration strengthens security by embedding scanning directly within the development workflow.

### Enhancements

* Performance improvements have been implemented in the Ad-hoc Scan Summary page to ensure enhanced user experience.
* New advanced filters have been added to the search bar on Ad-hoc Scan pages, enabling users to perform more precise and efficient searches.
* The OWASP Dependency Track tool has been integrated to enable automated analysis of SBOM files for vulnerabilities and risks, improving visibility into open-source component security.
* New clickable columns displaying the Artifact Name and Open Issues are introduced in the Source Scan page. Also, a Go to Artifact Page link has been added to allow users to easily navigate from the scan page to the respective artifact details page.
* API updates are made to allow users to upload SBOM reports for scanning through token-based authentication, enhancing security and enabling smoother integration with external tools.
* In Ad-hoc Scan pages, the dependency on repository SBOM components has been removed. Scans now proceed using dummy components, preventing scan failures. &#x20;
* Customized error handling has been introduced for Ad-hoc projects, ensuring that clear and meaningful error messages are displayed to users, improving troubleshooting and user understanding during scan operations.

## Version 2025.08.00

### Features:

* **Upload Project feature in the Ad-hoc Scan page** - In the Scan Now option, a new field named Upload Project is added, to add new projects by the user from their local system.&#x20;
* **EOL (End of Life) Feature Support for OSS Packages** - A new feature that indicates the EOD (End-of-life) for the OSS package is added in the SBOM page. Based on the EOL risk score, a band is set for the OSS packages by our OSS service. Also, an option for the user is allowed where the user can add a baseline version for a OSS project that is acceptable even though the risk score is different.
* **GitHub App Integration for On-Premises SSD Installations** - A secure architecture is designed to integrate SSD’s On premise installations with GitHub Apps integration without requiring public ingress to the on-premises environment. This design establishes a stateless public authentication server (one for handling installation and another for brokering token from Github) that handles GitHub App Authentication flows while maintaining security and data integrity across the trust boundary.
* **Dependency Scanning in SBOM** - The Dependency scanning feature is added to the SBOM page. The dependency scanning identifies the security vulnerabilities in the  application’s dependencies and protects it from security breaches.

### Enhancements

* All the vulnerable packages that were identified in the Source Scan are successfully upgraded to their secure versions.
* SSD is enhanced to automatically identify and scan on-demand the newly added branches or changes in the existing branches without manual intervention.&#x20;
* The PR firewall report in GitHub Actions will now link directly to the DBOM page of the scanned artifact. Earlier, it redirected to the general artifacts tab, which made finding the correct artifact difficult when many artifacts were present.&#x20;
* Bulk onboarding through API or UI is introduced in ad-hoc scanning so that users can now upload a predefined list of scan targets instead of one project at a time.
* A column named Branch, is added to the Artifact Security pages to display the source branch from which each artifact was built.&#x20;
* Workload Identity Federation (WIF) authentication type is added for the GCP integration.&#x20;
* The CLI is upgraded to a new version with .exe extension, allowing it to run directly on Windows without a docker image version.&#x20;

### Fixed Issues

* The gate restarted when the duration query parameter in the extend session endpoint was provided with an invalid text value.

## Version 2025.06.00

### Features:

* **Integration Support Expansion -** The coverage for integrations is expanded. It is extended to support all types of authentication modes and cloud/hosted solutions.&#x20;

  **Key Changes:**

  * &#x20;ZAP integration allows users to select a specific scan policy before triggering a DAST scan.
  * Non image SBOM scanning is supported in toolchains like image artifacts.
  * SAST scanning can be performed on public GitHub repositories without requiring the SCM integrator.&#x20;
* **Notification of Scan Status** - In the Scan Now feature, a new field to notify the status (pending/scanning/completed/failed) of the project is added. Also if status fails, an error message is displayed briefing the error.
* **Top 5 Vulnerabilities tab in the Vulnerability page** - A new tab named Top 5 Vulnerabilities is added in the Vulnerability page, providing quick visibility into the most critical risks for faster prioritization and remediation.
* **Scanning Support for C++ Projects** - Support for scanning the projects written in C/C++ languages is added. A CLI tool is developed that runs on development and build systems to analyze the dependencies of the project and report SBOM and Vulnerabilities.

### Enhancements:

* The following enhancements are made to the OSS page.
  * New licenses can be added, removed and it will trigger re-evaluation of the risk status of the library.
  * Copyright and source information are added to OSS.&#x20;
  * OSS Risk can be filtered and explored based on Application, Artifact and Component.
  * OSS reports can be downloaded in json, and PDF formats.
* The option to download Security Issues and Vulnerabilities in PDF format is added, enabling users to easily export the reports.
* The SBOM (Software Bill of Materials) report on the View Reports page of Source Scan is enhanced by including the Vulnerability column.&#x20;
* Expanded support for Artifact Ad-hoc Scanning to include a broader range of container registries: GitLab Container Registry, Docker Hub, Azure Container Registry (ACR), Google Container Registry (GCR), Google Cloud Storage (GCS), Amazon ECR, JFrog Artifactory, and Quay, ensuring wider coverage across diverse CI/CD environments.
* A new field named Scan Policy is added in the ZAP integrator that allows users to select specific scan policy before triggering a DAST (Dynamic Application Security Testing) scan.
* Comprehensive SBOM of all the artifacts can be viewed now. The View SBOM button is added in all of the artifact pages.&#x20;
* The following enhancements are done for usability of the product for risk, associated with source code repositories.
  * OSS Report can now be filtered based on the impacted source code repository.
  * Branch and Repository filters are added in the security issues, vulnerabilities and artifact security pages.

## Version 2025.05.00

### Features:

* **Azure Repos Integration -** Support for Azure Source Code Repositories is added to the Ad Hoc Scanning workflow. With this enhancement, users can initiate scans on repositories hosted in Azure DevOps, similarly to how they do for GitHub.
* **DAST Scan Addition** - The Dynamic Application Security Testing (DAST) process has been integrated into the Ad-hoc scanning workflow. As part of this process, essential details such as the service URL and related configuration parameters are collected from the ZAP integrator. Once this information is gathered, the scan is initiated using OWASP ZAP to identify potential security vulnerabilities.&#x20;

### Enhancements:

* The Toolchain API has been restructured and Temporal implementation is done to handle scan interruptions caused by pod failures or third-party service disruptions.
* The NVD and OSV vulnerability databases are now hosted on a centralized server. Customer environments will retrieve data from this centralized source, significantly reducing local memory usage and improving performance.
* SOC 2 compliance tags have been added to security policies within SSD, for improved security governance.
* GitLab server capabilities have been enhanced to support both Source Code Management (SCM) and Artifact Repository integrations.&#x20;
* In the new user interface, policy data is now fetched via APIs instead of UI queries. This change reduces browser load and significantly improves the speed and responsiveness of policy-related pages.
* Users can now select teams during Ad Hoc scanning, for more precise scanning.
* Support for Azure DevOps repositories has been added to Ad Hoc scanning. Users can now initiate scans on Azure-hosted code repositories, just as they currently do with GitHub, enhancing multi-platform flexibility.

## Version 2025.04.00

### Features:

* **Helm Scan Integration for Helm Charts from CI Events -** Helm chart scanning is now integrated into the CI events pipeline, enabling automated security checks as part of the CI build process. This integration supports scanning both the Helm templates and packaged charts, to detect vulnerabilities and misconfigurations earlier.&#x20;

### Enhancements:

* Performance fixes are done in the APIs of various pages in SSD UI.&#x20;
* Improvements are made to the OSS Scan to retrieve MTTR, Contributions, Contributors and Risk Calculation Formula data.&#x20;
* A download button to download reports as PDF is added in the Security Issues page.&#x20;
* Data is migrated to OpenGrep from Semgrep.&#x20;
* SSD is enhanced to be more durable by implementing new frameworks to handle huge data and retry after failures.
* Spinnaker is enhanced with API checks to ensure images are safe and compliant before the deployment proceeds.
* The SSD policies are restructured to support runtime updater and simplify the policy migration and definition. &#x20;
* Images or Namespaces of the services that are not required to be scanned can now be removed from the Kubernetes Detector. &#x20;
* More tags and controls are added to the security policies in SSD.
* SSD architecture is enhanced to improve its performance.&#x20;

### Fixed Issues:

* The logs for the user actions that occur in the SSD UI are not recorded in the API pods.
* File download using curl command fails when ssd-opa is run with multiple replicas.&#x20;

## Version 2025.02.00

### Features:

* **SysDig Integration -** SysDig is integrated in SSD, to identify security risks, including vulnerabilities, misconfigurations, insecure identities, and other critical risk factors, ensuring enhanced protection and safeguarding modern deployments.&#x20;
* **Adhoc Scan** - A new feature, Adhoc Scan, is introduced to run scans on source code and image repositories based on user configurations before deployment.&#x20;
* **Insights Metrics** - A new feature, Insights, is introduced to provide a comprehensive overview of SSD scan activities. This page displays key metrics, including:
  * Scan Activity Overview:
    * Active scans count
    * Completed scans count
    * Failed scans count
  * Source Code Repository Scans
    * Active repository scan count
    * Completed repository scan count
    * Failed repository scan count
  * Additional Insights
    * Number of newly discovered repositories
    * CI/Build events received count

### Enhancements:

* A download button is added to the Security Issues page to download the CSV and Json files.&#x20;
* Performance fixes are done in the Security Issue and Vulnerabilities pages to improve the response time of the APIs.
* Improvements are made in the Helm Chart and Deployment Structures to increase scalability.&#x20;
* As part of CI event, SSD is enhanced to receive location of source code and filter Snyk results based on source code identifiers.
* Improvements have been made to the Github actions workflow.&#x20;
* Vulnerabilities identified through CSPM policies can now be added to the exception list, preventing them from generating alerts.

### Fixed Issues:

* Resources are not being populated in the Global Risk Management page during CSPM scans.&#x20;
* Inconsistency in the vulnerability popup when accessed via Vulnerabilities page and from the Policy violation page.&#x20;

## Version 2025.01.00

### Features:

* **JFrog Xray Integration -** JFrog Xray is integrated in SSD to retrieve artifact scan data. JFrog Xray analyzes the artifacts uploaded to the JFrog Artifactory. Through this integration, SSD is able to fetch the SBOM (Software Bill of Materials) and scan results of the artifact from JFrog Xray and store the data in the Dgraph database.

### Enhancements:

* The context graph is enhanced to display the Network Map information for the selected service.&#x20;
* In the API-Powered Remediation option, CVE/CWE details are retrieved from the NVD database hosted in SSD and provided as contextual prompts to ChatGPT.&#x20;
* The Open Source and third party tools database is upgraded to latest.
* The JIRA ticket resolution has been enhanced to be bi-directional. If the ticket is resolved and closed in the JIRA application then the ticket created in the alert is resolved and closed by default.&#x20;

## Version 2024.11.00

### Features:

* **MobSF Integration for Static and Dynamic Scans -** MobSF is now integrated with SSD, enabling static and dynamic security scans for mobile applications. This includes penetration testing, malware analysis, and privacy assessments.
* **TFsec Integration for Terraform Security** - SSD now supports TFsec to scan and manage infrastructure and deployments using Terraform scripts, enhancing security compliance in Infrastructure as Code (IaC).
* **CI Data Collection Scanning Support in Jenkins Plugin** - The Jenkins plugin now supports source code scanning by installing scanning tools as Command-Line Interfaces (CLIs) within the Tool-Chain container. This allows Go programs to execute security scans directly on the application's source code.

  Additionally, a Go-based CLI has been developed to seamlessly integrate scanning tools into the CI pipeline, improving automation and security coverage.

  **Key Benefits:**

  * **Platform Independence**: Compatible across different environments.
  * **Optional SCM Tool Credentials**: Removes the need for storing repository credentials in specific configurations.
  * **Optimized Resource Utilization**: Reduces the load on the Tool-Chain service, enhancing CI/CD efficiency.

  These enhancements strengthen security and improve the efficiency of source code scanning in Jenkins-based CI pipelines.
* **Multi-Account Support and RBAC for Integrators** - SSD introduces Multi-Account Support and Role-Based Access Control (RBAC) for integrators, improving security and access management.

  **Key Enhancements**:

  * **Restricted Account Access**: Only authorized teams can access specific accounts, preventing unauthorized usage.
  * **Controlled Integrator Visibility**: Integrators are visible only within assigned accounts, ensuring a secure and streamlined user experience.Multi-Account Support and Role-Based Access Control (RBAC) for integrators is introduced in this release, ensuring enhanced security and access management.
* **ScoutSuite Integration for CSPM with Cloud Custodian** - SSD now integrates ScoutSuite with Cloud Custodian to perform comprehensive Cloud Security Posture Management (CSPM). This enables security scanning of public cloud infrastructure, ensuring compliance and risk mitigation.
* **Helm Chart Scanning in SSD** - SSD now supports Helm Chart pre-deployment security scanning. This feature detects vulnerabilities and can generate alerts or block insecure deployments using the Deployment Firewall, along with security tools like Trivy and Snyk.

### Enhancements:

* Deployment History Graphs are now displayed using D3 charts instead of FusionCharts, improving visualization and performance.
* Added a new Vulnerability Enrichment grid to the Vulnerability page. This grid displays Exploitation, Automatable, and Technical Impact insights for vulnerabilities.
* Jenkins plugin scan results are now displayed by default in SSD. Previously, users had to manually enable or disable this option.&#x20;

### Fixed Issues:

The following issues are fixed in this release:

* "No Data to Validate" error in ZAP integrator when Username and Password fields were empty, in ZAP integrator.
* Smart Search in the Artifact Security Page failed to load filtered results for multi-select values in the Artifact Security page.
* Artifact count display issue on the Artifact Security Page. Previously, it incorrectly displayed zero.
* Path traversal vulnerability in the DAST scan report.

## Version 2024.10.00

### Features:

* **Global Exception Creation Feature -** A new feature has been introduced in the Alert Summary popup, enabling the creation of global exceptions. Users with admin permissions can now create global-level exceptions. Once created, these exceptions will be logged and displayed on the Audit page for tracking and review.
* **Enhanced CI/CD Workflows: Multi-Artifact Discovery Support** - The Jenkins plugin for SSD now supports sending build and deployment events for multiple image artifacts and binary artifacts in a single job, expanding CI/CD workflow capabilities.

  **Key Enhancements:**

  * Multiple image artifact support.
  * Binary artifact support for non-image artifacts.
* **Expanded Registry Support: Scan Docker Images on GCR & ACR** - This release adds support for:

  \- Google Container Registry (GCR): Identify vulnerabilities in Docker images

  \- Azure Container Registry (ACR): Detects security risks in container images.
* **Open Source Risk Management Analysis** - A new feature is added that focuses on helping the customer evaluate the risk status of the various open-source components within their software projects. Detailed insights and assessments of the findings are displayed on the OSS Risk page for better visibility and management.
* **Jenkins Plugins Risk Assessment through the Enabled Plugins** - A new feature is added to identify all plugins installed on a customer's Jenkins system and assess their risk levels based on detailed vulnerability profiles.&#x20;

  **Key Enhancements:**

  * Actionable policies will be created based on the derived data.
  * The data will be incorporated into the build section of the DBOM for comprehensive risk representation.

### Enhancements:

* Optimised Policies Update Workflow page for improved performance and responsiveness.

### Fixed Issues:

The following issues are fixed in this release:

* Integration passwords and tokens are now properly encrypted when saved.
* Role-Based Access Control (RBAC) now correctly handles team selection changes.
* Smart search hierarchy is introduced in the ‘Vulnerability’ feature.
* Inconsistencies in the data displayed across different views within the product.&#x20;
* Optimization of the performance of the Stage Graph API in the artifact page by replacing individual deployment queries for each artifact with a bulk query to retrieve stages for all artifacts simultaneously.
* License data is not displayed in the SBOM popup; however, the licenses are visible in the downloaded SBOM file.
* Context Graph links on the Demo Server are broken, impacting navigation.

## Version 2024.09.00

### Features:

* **OWASP ZAP DAST Tool Integration** - Delivery Shield now supports OWASP ZAP DAST tool, thus enhancing the ability to assess the security posture of applications in their operational state by actively testing it for vulnerabilities. By evaluating applications in real time, the DAST tool provides security assurance by identifying potential vulnerabilities that might otherwise go unnoticed.

### Enhancements:

* Performance improvements have been implemented across various pages including Security Issues, Vulnerabilities and Artifact Security as listed below:
  * Alerts Graphs in Security Issue Page&#x20;
  * Alerts Page Smart Search&#x20;
  * Alerts Page Listing&#x20;
  * Vulnerability Page Smart Search&#x20;
  * Vulnerability Page Listing&#x20;
  * Policies Update Workflow&#x20;
  * Exceptions add-on to alerts
  * Exceptions add-on to vulnerabilities&#x20;
  * Most Frequent Security Issues&#x20;
  * Artifact Security Page Listing&#x20;
  * Trivy Image scans&#x20;

## Version 2024.08.00

### Features:

* **Application Versions Tracking** - Delivery Shield now allows tracking of application versions. Users can tag artifacts with application and version information, enabling application stack visibility in the dashboard. It also supports continuous scanning and uniform artifact presentation.
* **Delta Cloning** - Delivery Shield enables efficient processing of large monorepos by cloning only the changed files thus improving  the performance and reducing operational issues.
* **Support for K8s and Non-K8s Deployments on the same instance** - Delivery Shield now supports managing both Kubernetes and non-Kubernetes deployments within a single SSD instance. This feature simplifies deployment management and enhances flexibility.
* **Importing CVE Suppression List** - Delivery Shield enables users to import lists of suppressed CVEs or non-fixable CVEs and also supports CSV file uploads and UI filtering.
* **Jira Plugin Automation** - To track the high-priority security issues found through Delivery Shield, Jira tickets can be created. With this release, one can automate the Jira creation relieving the user from manual task. With this automation with Jira, the security incident management is streamlined.
* **Exception Workflows and Approval Process** - Delivery Shield has now introduced a workflow for processing security exceptions. The approval processes are enabled and the security incident management is enhanced.

### Enhancements:

* **CVE Prioritization** - The CVE prioritization column is enhanced to display the correct severity of the vulnerabilities.
* **Vulnerability Prioritization Graph** - The Y-axis in the Vulnerability Prioritization graph is changed to **Priority** instead of **EPSS** to improve the visualization of the priority information.
* **OSV and NVD** - The Vulnerability Report is enhanced to cover data from multiple vulnerability databases such as Integrated Open Source Vulnerability (OSV), National Vulnerability Database (NVD) and GHSA (GitHub Security Advisory) to improve the performance of the generated reports.&#x20;
* **Alert Popup** - The alert popup is enhanced to include relevant metadata to make it more actionable.&#x20;
* **Jenkins Plugin** - Token-based authentication is implemented in Jenkins plugin to enhance security for API access.

## Version 2024.07.00

### Features:

* **Bitbucket Pipelines Integration** - Delivery Shield now supports Bitbucket Pipelines as a CI tool. It can receive build events from Bitbucket Pipelines, performing security scans on both the build pipeline and the artifacts produced.
* **Codacy Integration** - Delivery Shield integrates with Codacy to gather source code scan results. These results are evaluated against secure software delivery policies and are factored into the application’s overall security score.

### Enhancements:

* **Jenkins Plugin Enhancements** - The Delivery Shield Jenkins plugin now supports Jenkins jobs that produce JAR and WAR files. It can detect, scan, and continuously monitor these files built by Jenkins.
* **License and Vulnerability data in SBOM** - The Software Bill of Materials (SBOM) generated by Delivery Shield now includes license and vulnerability data for each component, enhancing transparency and security insights.
* **POST API Mode for SonarQube** - SonarQube scan results can now be posted to Delivery Shield via an API, in addition to the previous fetch-based mechanism for greater efficiency.

## Version 2024.06.00

### Features:

* **License Scanning** - Delivery Shield now scans your code repositories and build artifacts (including images and packages) to detect third-party libraries and their associated licenses. It identifies the use of restricted license categories and flags them as security issues.
* **Sneak SAST Integration** - Delivery Shield integrates with Snyk SAST to collect source code scan results. These results are evaluated against secure software delivery policies and are factored into the overall application security score.
* **Virus Total Integration** - Delivery Shield detects URLs in your codebase and build pipelines, using VirusTotal to flag any malicious URLs.
* **ECR Integration** - Delivery Shield now supports Amazon ECR as an artifact storage solution. It can fetch artifacts from ECR and perform security scans on them.

### Enhancements:

* **AI-powered Remediation Enhancements** - The AI-powered remediation now includes the ability to generate recommendations for upgrading insecure dependencies and suggest alternatives to vulnerable libraries.
* **Scanning Status** - A new status, **Scanning** is introduced across multiple pages to clearly indicate when a security scan is in progress.
* **DBOM enhancements** - The Delivery Bill of Materials (DBOM) is streamlined by reducing the number of subcategories under each stage, making it easier to navigate and manage.

## Version 2024.05.00

### Features:

* **Vulnerability Prioritisation** - Delivery Shield now can prioritize vulnerabilities using an algorithm that takes into account parameters such as exploitability, severity, and KEV Database.
* **Deduplication** - Delivery Shield now can deduplicate vulnerabilities and security issues, allowing security teams to better focus on resolving these issues. In the alert detail popup, a new section called "Show Impacted Components" has been added. This section enables users to view the complete list of Accounts, Applications, Artifacts, and Services affected by a vulnerability.
* **Artifact Security** - The new artifact security feature displays a list of all artifacts auto-discovered by Delivery Shield, along with their security status. It also allows viewing the lifecycle of these artifacts and downloading security scan results related to them.
* **JIRA Integration** - User can create a JIRA ticket directly from the alert details screen, which will include all relevant information for developers to track and resolve the issue.
* **GitHub Actions Integration** - Delivery Shield now supports GitHub Actions as a CI tool. It can receive build events from GitHub Actions to run security analysis of the build pipeline as well as the produced images.
* **Cluster Management -** The new Clusters page enables users to connect their Kubernetes clusters to Delivery Shield, allowing Delivery Shield to continually monitor the security posture of the connected clusters and send alerts when necessary.

### Enhancements:

* The App level policies are now listed based on the tools used in that application context. Users have to deal with only the policies required by the selected application.&#x20;

### Bug Fixes

* The policy page performance issues have been resolved.

## Version 2024.04.00

### Features:

* **Vulnerability scanning for Debian packages** - Delivery Shield can now detect vulnerabilities in Debian packages.
* **Support for the Spinnaker Bake Stage** - Delivery Shield can process events emitted by the Spinnaker image bake stage to analyze the composition of a machine image.
* **Support for Machine Image Deployments** - Delivery Shield now detects and performs scans on machine image-based deployments executed via Spinnaker, providing support for machine image deployments.
* **Agentless Kubernetes Scans** - kube-detector is the Delivery Shield component used to scan Kubernetes clusters. It can now perform scans without running an agent in the cluster.
* **BitBucket Integration** - The new Bitbucket integration enables Delivery Shield to retrieve metadata about the source code repository and perform security scans to produce reports such as the OpenSSF Scorecard.

### Enhancements:

* Support for running multiple kube-detector instances along with Delivery Shield is now available, allowing them to point to different Kubernetes clusters.
* **NamespacesToAllow** and **NamespacesToIgnore** fields in the kube-detector configuration allow users to specify the set of namespaces to watch and ignore, respectively.

### Bug Fixes

* Minor bug fixes.&#x20;

## Version 2024.03.00

### Features:

* **Organization Structure and RBAC** - A new three-tier organizational structure is introduced in this release that enables customers to manage their applications across various business units and teams using a single Delivery Shield instance. Additionally, it offers an enhanced Role-Based Access Control system for better control over the user permissions.
* **Kubernetes Discovery** - Deploy Shield detects changes in a Kubernetes cluster and enforces security policies through agent-based resource discovery.

### Enhancements:

* UX enhancements.
* Minor bug fixes.

## Version 2024.02.00

### Features

* **Non-Blocking mode** - Delivery Shield can be used in a non-blocking mode by disabling the deployment firewall feature, that is best suited for lower environments like Development and QA. This mode doesn't block deployments but evaluates policies and generates security alerts.&#x20;
* **New integrations**
  * Integration with Gitlab to collect source code metadata, Git security posture checks, and generate an OpenSSF Scorecard.
  * Integration with Jfrog Artifactory to fetch images and run security scans.&#x20;
  * Integration with Snyk to run Security scans and fetch reports.
* **Support for Non-Kubernetes deployments** - It is now possible to conduct security scans on Amazon ECS deployments using Delivery Shield.
* **UI For managing Delivery Shield Integrations** - A new page named **Integrations** is added to the **Config** menu. This page enables users to integrate and manage Delivery Shield with their preferred DevOps tools.

### Enhancements

* **Enhanced Navigation Experience** - The navigation structure is revamped and new menu items are added, to support additional use cases and personas.&#x20;

## Version 2023.11.00

### Features

* **Policy as Code and GitOps** - Users can transform security policies into code, store them in a Git repository, and periodically synchronize them with Delivery Shield.
* **Helm Charts Security** - Delivery Shield has introduced support for Helm chart scanning. This feature enables the identification of misconfigurations and security issues within the Helm charts.

### Enhancements

* Improved workflow for **Integrating Jenkins with Delivery Shield**.&#x20;
* Users can now perform bulk actions on the **Rules Configuration** page by selecting multiple rules and modifying them simultaneously.
* The **Delivery Bill of Materials (DBOM)** page has been improved with better labelling and grouping of information.

## Version 2023.10.00

### Features

* **Kubernetes Hardening Analysis**
  * CIS Benchmark analysis for Kubernetes clusters - Delivery Shield automatically evaluates connected clusters for CIS Benchmark compliance using 200+ predefined deployment firewall rules. Kubernetes posture-related alerts and suggestions are available on the Manage Alerts Page.
  * Additionally, it allows for the assessment of your clusters according to the guidelines provided by NSA-CISA and MITRE ATT\&CK.
* **Jenkins Integration** - Delivery Shield now supports Jenkins as a build and deployment tool, gathering information to improve security posture through alerts and recommendations.
* **Deployment History Timeline** - The application status page now displays cluster deployments as a timeline graph, providing an audit trail and historical view of changes to cluster security posture.
* **Vulnerability Report** - The application status page now displays vulnerability reports for both the application and service.

### Enhancements

* Added support for user-defined tags for deployment firewall rules, allowing users to group rules based on the custom logic.
* Expanded the functionality of the smart search feature to include the alerts and vulnerabilities report page.
* Added the ability to distinguish between alerts on the current and the old versions of running applications.

## Version 2023.09.00

### Features

* **Deployment Firewall** - The Kubernetes cluster can now automatically block insecure application versions from being deployed by running an admission control mechanism. This decision-making is powered by Delivery Shield's security analysis and data collection throughout the software delivery lifecycle.
* **New SAST Integrations** - Delivery Shield can now mandate SAST scans during software development, analyze reports to provide suggestions, and update the application's risk status by connecting to SonarQube and Semgrep.
* **Smart Search** - The ability to discover vulnerabilities, images, and other components across all applications allows for easier identification of newly found vulnerabilities within existing applications.
* **OpenSSF Scorecard Integration** - Connected git repositories will receive an OpenSSF scorecard with security posture alerts and suggestions accessible on the Manage Alerts Page.
* **NIST and FedRAMP Compliance Automation**  - Delivery Shield now includes prebuilt policies for NIST 800-53 and FedRAMP compliance, with suggestions for fixing issues and achieving 100% compliance.
* **Rules Genie** - A new AI assistant that creates custom deployment firewall rules based on business requirements.&#x20;
* **Alerts Genie** - A new AI assistant that helps understand security alerts and recommends solutions.

### Enhancements

* **Application level Smart Diff and Application DBOM** - Users can now perform Smart Diff at the application level and view the Delivery bill of materials for the entire application version.
* **Search and filtering options** - In the Alerts Management and Rules Configuration pages, you can access additional search and filtering options.

## Version 2023.08.00

### Features

* Ability to collect software delivery data from Git, Jenkins, Spinnaker, Kubernetes, and Aqua Trivy.
* **Supply chain dashboard** - Helps you to view the organization-level security posture, applications and their risk status and security alerts.
* **Application status page** - Displays the security status, active vulnerabilities, and alerts of the running services.
* **Alerts Management** - Ability to track and resolve security alerts across environments with Delivery Shield suggestions.
* **SBOM** - Generate software bill of materials for the deployed images.
* **DBOM** - The Delivery Bill of Actions and Materials is a comprehensive report that offers complete visibility of the software development process, from coding to deployment. It keeps track of crucial information such as tools used, actions taken, artifacts produced, and security checks performed during the software delivery process. This report serves as a valuable tool to monitor and optimize software development.
* **Smart Diff** - Helps you to dry run code promotion from one environment to another. By doing so, you can compare the services that run in different environments in terms of their security status, active alerts, vulnerabilities, and dependencies. This helps you understand the impact that a new version of a service may have when deployed to production.
* **Slack Integration** - Ability to share alerts to Slack channels.


# Configuration Changes


# Config Changes for v2026.06.00


# Config Changes to Add OpsMx Assistant (NLI) in SSD

Follow the steps below and do the given configuration changes to add OpsMx-Assistant(NLI) in SSD.

* Add the opsmx-assistant as a service in the namespace that NLI is deployed.
* Update the configuration to support the OpsMx Assistant.
* Once the ssd-ui is loaded, the OpsMx Assistant button will appear at the top-right corner of the homepage, enabled and ready to use.&#x20;

#### Configuration Changes:

1. Add these lines in the **ssd-ui-nginxconf** before /ui

{% code overflow="wrap" %}

```
# Opsmx-assistant — MUST be before /ui
        location ^~ /ui/assistant/ {
          proxy_pass http://opsmx-assistant:8080/;
          proxy_http_version 1.1;
          proxy_set_header Host $host;
          proxy_set_header X-Real-IP $remote_addr;
          proxy_set_header X-Forwarded-For $proxy_add_x_forwarded_for;
          add_header Access-Control-Allow-Origin $http_origin always;
          add_header Access-Control-Allow-Credentials true always;
          add_header Access-Control-Allow-Methods 'GET, OPTIONS' always;
          add_header Access-Control-Allow-Headers 'Content-Type' always;
        }
```

{% endcode %}

2. Add these lines in **app-config**

{% code overflow="wrap" %}

```
"enableNLI": true,
    "CHAT_NATURAL_LANGUAGE": "ssdservice/v1/nli",
    "GET_NLI_CHAT_HISTORY": "ssdservice/v1/nli/chats/user",
    "GET_NLI_CHAT_MESSAGES": "ssdservice/v1/nli/chat/",
    "chatMfeUrl": "/ui/assistant",
    "showChatHistory": "true"
```

{% endcode %}


# Config Changes to Enable BIR in SSD

### UI Configuration

Set the below flags to true in the config.json file to enable the BIR feature.&#x20;

{% code overflow="wrap" %}

```
"airemediation": true,
"bir": true,
```

{% endcode %}

The feature will be available in **Scan Now -> Artifact Scan** page.&#x20;

Once the feature is enabled,&#x20;

1. Option to upload Dockerfile will be available in the configuration section of **Add Project** page.&#x20;
2. **Remediation** tab will be displayed in the View Section.&#x20;

#### Limitations and conditions

Users can upload the DockerFile under the following conditions:

* When ArtifactTag is selected as Latest.&#x20;
* When ArtifactTag is selected as All, and user selects one Tags/Tag pattern. &#x20;

{% hint style="info" %}
Dockerfile name should include ‘DockerFile’ in any case.&#x20;

* Supported file extensions are .prod, .dev, .txt
* &#x20;Unsupported file extensions are .yaml, .java .pdf
  {% endhint %}

<br>


# Security Risk & Prioritization

Modern software delivery pipelines generate thousands of security findings across source code, open-source dependencies, containers, infrastructure, cloud environments, and runtime systems. Security teams often struggle to determine which vulnerabilities require immediate attention and which can be deprioritized.

OpsMx Delivery Shield addresses this challenge through intelligent risk prioritization and continuous security assessment across the entire software delivery lifecycle. By correlating security findings with deployment context, runtime exposure, exploitability, and compliance posture, OpsMx helps organizations focus on the risks that matter most.

OpsMx introduces a context-aware approach to vulnerability prioritization by combining:

* Vulnerability severity
* Runtime context
* Reachability analysis
* Open-source risk intelligence
* Policy compliance status
* Deployment exposure
* Threat intelligence and exploitability signals

This enables organizations to reduce alert fatigue, accelerate remediation, and improve the overall security posture of their software delivery ecosystem.

## Why Security Risk Prioritization Matters

Modern applications are built using distributed architectures, cloud-native services, open-source packages, containers, APIs, and Infrastructure as Code (IaC). As environments scale, security tools generate a large volume of overlapping alerts from multiple scanners and platforms.

Without contextual prioritization:

* Security teams become overwhelmed with alerts
* Developers spend excessive time triaging issues
* Critical vulnerabilities remain unresolved
* Release velocity slows down
* Compliance visibility becomes fragmented

OpsMx Delivery Shield continuously evaluates and prioritizes risks across the code-to-cloud lifecycle, enabling teams to focus on exploitable and business-critical vulnerabilities instead of treating all findings equally.

## OpsMx Security Risk Prioritization Approach

### Unified Risk Intelligence

OpsMx Delivery Shield aggregates findings from multiple security scanners and correlates them into a centralized security intelligence platform.

Supported security capabilities include:

* Static Application Security Testing (SAST)
* Dynamic Application Security Testing (DAST)
* Software Composition Analysis (SCA)
* Secret Detection
* Infrastructure as Code (IaC) Security
* Container Scanning
* Cloud Security Posture Management (CSPM)
* SBOM Analysis
* Open-Source Risk Analysis

This creates a unified view of application and infrastructure risk across the SDLC.

### Context-Aware Risk Scoring

OpsMx prioritizes vulnerabilities using contextual analysis instead of relying solely on severity scoring.

Risk scoring factors include:

* CVSS severity
* Runtime exposure
* Reachability analysis
* Deployment context
* Compliance impact
* Open-source risk indicators
* Security policy violations

This enables security teams to focus on vulnerabilities that pose actual operational and business risk.

### Continuous Risk Assessment

OpsMx continuously monitors applications, pipelines, repositories, and infrastructure to identify newly introduced risks throughout the software delivery lifecycle.

Continuous assessment capabilities include:

* Real-time vulnerability monitoring
* Pipeline security validation
* Deployment risk evaluation
* Continuous compliance verification
* Security posture monitoring

This ensures that risks are identified early and addressed before deployment into production environments.

### Automated Policy Enforcement

OpsMx enables organizations to enforce security and compliance policies directly within software delivery pipelines.

Capabilities include:

* Deployment firewall enforcement
* Compliance validation
* Policy-based approvals
* Secure deployment gating
* Automated compliance checks

Organizations can prevent insecure or non-compliant releases from progressing through the deployment pipeline.

## Core Capabilities

### Vulnerability Management and Prioritization

OpsMx helps organizations identify, prioritize, and remediate vulnerabilities across applications and infrastructure.

Key capabilities include:

* Risk-based prioritization
* Vulnerability correlation
* Exploitability assessment
* Centralized risk visibility
* Faster remediation workflows

### Source Code and Dependency Security

OpsMx continuously scans source repositories and dependencies for security issues including:

* Vulnerable dependencies
* Secrets exposure
* License risks
* Static code vulnerabilities
* Open-source supply chain risks

The platform supports automated and scheduled scans across GitHub, Bitbucket, GitLab, Azure DevOps, and other SCM platforms.

### Deployment Security and Governance

OpsMx strengthens deployment security through intelligent policy enforcement and deployment verification.

Features include:

* Deployment firewall
* Deployment Bill of Materials (DBOM)
* End-to-end traceability
* Automated approvals
* Secure release governance

These capabilities improve operational visibility while ensuring secure software delivery.

### Compliance and Audit Readiness

OpsMx helps organizations automate compliance validation using predefined frameworks and customizable policies.

Supported compliance initiatives include:

* NIST 800-53
* PCI DSS
* HIPAA
* SOC 2
* Organizational security policies

Continuous compliance monitoring helps organizations maintain audit readiness across their software delivery processes.


# View Security Posture

This section explains about the following topics:&#x20;

* [Organization Security Posture](https://docs.opsmx.com/opsmx-secure-software-delivery-ssd-platform/user-guide/view-security-posture/organization-security-posture)
* [Application Security Posture](https://docs.opsmx.com/opsmx-secure-software-delivery-ssd-platform/user-guide/view-security-posture/application-security-posture)
* [View Open Security Issues](https://docs.opsmx.com/opsmx-secure-software-delivery-ssd-platform/user-guide/view-security-posture/view-open-security-issues)
* [View Current Deployments](https://docs.opsmx.com/opsmx-secure-software-delivery-ssd-platform/user-guide/view-security-posture/view-current-deployments)
* [View Deployment History](https://docs.opsmx.com/opsmx-secure-software-delivery-ssd-platform/user-guide/view-security-posture/view-deployment-history)&#x20;


# Organization Security Posture

The Organization Security Posture page is the default landing page upon logging in to Delivery Shield. It provides a consolidated, organization-wide view of application risk status, open security issues, and deployment activity across your software supply chain.

<figure><img src="/files/vB1tvbsPf98BTiQIgX2o" alt=""><figcaption></figcaption></figure>

### Staging / Production / Dev Environment

The dashboard displays application and their data specific to a environment. Select the **Environment** from the Environment panel adjacent to the Application Summary panel, to filter the view by **Dev**, **Staging**, or **Production**.

<figure><img src="/files/Yd6XmuuPA6sqCj95ne3o" alt=""><figcaption></figcaption></figure>

### Summary Panel&#x20;

The Summary Panel appears at the top of the dashboard and consists of three sub-panels:

**Application Risk** — Displays the total number of onboarded applications and their distribution across risk levels. Risk levels are determined by rule validations performed at each stage of the software supply chain. Each rule carries a weighted score, and the aggregate score at the service and application level determines the overall risk classification. Possible risk levels are: Critical Risk, High Risk, Medium Risk, Low Risk, and Scanning.

**Open Security Issues** — Displays the total number of active security alerts across all applications, categorized by supply chain stage: Source, Build, Artifact, Deploy, and Post Deploy. Clicking anywhere on this panel navigates to the **Security Alerts** details page.

**Deployment Status** — Displays the total count of allowed and blocked deployments across all the applications. This panel provides a quick view of deployment gate enforcement activity across the organization.

<figure><img src="/files/Of3lf9EbAZYuogVqqJ33" alt=""><figcaption></figcaption></figure>

{% hint style="info" %}

1. The various features available in Delivery Shield are displayed in the left panel.
2. A toggle button to expand and collapse the feature list is provided at the bottom.&#x20;
3. You can logout of the application by clicking the Logout button.&#x20;
   {% endhint %}

### Application Summary&#x20;

The Application Summary table is displayed below the Summary Panel and lists all onboarded applications with their current security details. The table includes the following columns:

<figure><img src="/files/RFb8Lb0Y8XwO92bdO8S4" alt=""><figcaption></figcaption></figure>

* **Application** — The unique name of the application. Click the application name to navigate to the Application Security Posture page.
* **Version** — The latest tracked version of the application.
* **Stage Scores** — The number of artifacts built and deployed for the application.
* **Last Deployed** — The date and time of the most recent deployment.
* **Team** — The team responsible for the application.
* **Namespace** — The Kubernetes namespace associated with the application.
* **DBOM Status** — The Deployment Bill of Materials status. Click **View** to open the full DBOM report for the application.
* **Cluster** — The name of the cluster to which the application is deployed.
* **Open Issues** — The number of unresolved security issues for the application.
* **Owner** — The user who created the application in Delivery Shield.

You can choose the group or team for which you want the applications to be listed by clicking the **Teams** button. On clicking **Teams**, the list of available teams appears as shown below:

<figure><img src="/files/TbLgHC2wFtu7219sm3U0" alt=""><figcaption></figcaption></figure>

To view the Application Summary of a specific team's applications, click the **Teams** button. Select one or more teams from the list that appears, then click **Apply**. The table then only displays the applications associated with the selected team(s). For information on managing teams and access, refer [Viewing Access Management](https://docs.opsmx.com/opsmx-secure-software-delivery-ssd-platform/user-guide/viewing-access-management).&#x20;

### Smart Search&#x20;

The Smart Search feature enables you to filter and locate applications based on specific attributes. Applications can be searched based on **Application Name, Artifact, Cluster, Component, Risk Status, Vulnerability**.&#x20;

To perform a search, click the search bar, select a category from the dropdown, enter the search term, and press **Enter**. The Application Summary table updates to display matching results.

<figure><img src="/files/Q0keiabBtQwW0Gvw597y" alt=""><figcaption></figcaption></figure>

The following example shows searching for the applications based on the **Vulnerability**.

* Select **Vulnerability** from the search dropdown. Enter the vulnerability name as shown below and press **Enter**. The applications with the specified vulnerability are displayed.&#x20;

<figure><img src="/files/iRCUqWtXaXsVFe7LAlIU" alt=""><figcaption></figcaption></figure>

* Click the application name and the affected environment is highlighted and the current deployments impacted by the vulnerability are displayed as shown below:

<figure><img src="/files/PV37EJRPDFZ1lxCdSDpJ" alt=""><figcaption></figcaption></figure>

* Click the **Vulnerability** count for any deployment. The vulnerabilities details page is displayed. In  the search bar, select **Vulnerability**, and choose the same vulnerability name. All components associated with that deployment and vulnerability are listed. &#x20;

### Show/Hide Columns

The column customization option is also available. You can prefer to show or hide the columns in the applications list. To do so, click the (three dots) **Show / Hide Columns** icon. The list of available columns will appear.&#x20;

<figure><img src="/files/GgNbL2u3yhdv39hisQOQ" alt=""><figcaption></figcaption></figure>

You can select/deselect a particular column from the drop-down to add/remove it from the applications table as shown below:

<figure><img src="/files/LM4tgupNTg1L8Pxor26e" alt=""><figcaption></figcaption></figure>


# Application Security Posture

On clicking any application, various pages detailing the different security posture of the application are displayed as given below:

* [Application Status ](https://docs.opsmx.com/opsmx-delivery-shield-platform/user-guide/view-security-posture/application-security-posture/application-status)
* [Version History](https://docs.opsmx.com/opsmx-delivery-shield-platform/user-guide/view-security-posture/application-security-posture/version-history)
* [Context Graph](https://docs.opsmx.com/opsmx-delivery-shield-platform/user-guide/view-security-posture/application-security-posture/context-graph)
* [Deployment Firewall](https://docs.opsmx.com/opsmx-delivery-shield-platform/user-guide/view-security-posture/application-security-posture/deployment-firewall)
* [Policies](https://docs.opsmx.com/opsmx-delivery-shield-platform/user-guide/view-security-posture/application-security-posture/policies)
* [DBOM](https://docs.opsmx.com/opsmx-delivery-shield-platform/user-guide/view-security-posture/application-security-posture/dbom)
* [Integrations](https://docs.opsmx.com/opsmx-delivery-shield-platform/user-guide/view-security-posture/application-security-posture/integrations)


# Application Status

The Application Status page displays the following details of the application.&#x20;

* Environment
* Supply Chain Stages
* Active Deployments and Deployment History&#x20;

### Environment

The Environment panel displays the environment details in which the application is deployed, the namespace and cluster of the selected application.&#x20;

<figure><img src="/files/8QdMOdCjAclgVJQVsEBg" alt=""><figcaption></figcaption></figure>

### Application Version

* **Latest Application Version -** This panel displays the latest version of the application. The version of the service that is updated lately is displayed as the application version.&#x20;
  * To add a new version number, click the **+ Add Semantic Tag** button. In the expanded row, select a version and click **Update**. &#x20;
  * The added new version gets updated as the application's latest version.&#x20;

<figure><img src="/files/qOd6TiBzrGivwVRfgg5N" alt=""><figcaption></figcaption></figure>

{% hint style="info" %}
The version cannot be updated individually for the services and can be done for the entire application only.&#x20;
{% endhint %}

### **Supply Chain Stages**

This panel displays the security score of the application in each stages of the software supply chain namely **Source**, **Build**, **Artifact** and **Deploy**.

<figure><img src="/files/GTh60UiKybtO1YCbVul4" alt=""><figcaption></figcaption></figure>

### Deployment History

The panel at the bottom displays the **Active Deployment** and **Deployment History** of the application.

<figure><img src="/files/5p56eESkxUH1pKR3HhTT" alt=""><figcaption></figcaption></figure>

The following details of the active deployments are displayed:

* **Service -** Displays the name of the service of the application.&#x20;
* **Version -** Displays the version of the selected application.&#x20;
* **Artifact -** Displays the name of the artifact in which the service is deployed.&#x20;
* **Deployed At -** Displays the date and time of the deployment.&#x20;
* **Vulnerability -** Displays the count of the vulnerabilities.&#x20;
* **Open Issues -** Displays the count of the open issues detected.&#x20;
* **DBOM Status -** Displays the DBOM status of the service.&#x20;

### Smart Search

The smart search option available in this page, helps you to search for a deployment based on the selected option.&#x20;

<figure><img src="/files/XXJ9vJx317SavF1ZaHz7" alt=""><figcaption></figcaption></figure>

* Select **Artifact, Artifact Version, Component, Risk status, Service** or **Vulnerability** from the search dropdown and enter the name.&#x20;
* Press **Enter.**&#x20;

The services with the given component or vulnerability are displayed.&#x20;


# Version History

The version history page displays the details of all the versions available for the application. The versions that are sent during deploy events are displayed here. (Versions from the build events are shown in the artifact security page). The versions can be added from the Application Status page too.&#x20;

{% hint style="info" %}
&#x20;Version changes applied from the application status page will be applied to all the services of the application.&#x20;
{% endhint %}

### To Access Version History

* Navigate to **Applications** -> **Version History**. The Version history details page is displayed.&#x20;

The upper panel of the page displays the **Environments** tab. You can select the Environment (eg: dev or staging), Cluster and Namespace for which you want the version history to be displayed.&#x20;

The details panel displays the following:

<figure><img src="/files/yTkuaZT7mzMyPcLOGcHT" alt=""><figcaption></figcaption></figure>

* **Version** - Displays the different versions of the application.
* **Created At** - Displays the date and time when the service with the given version was created.&#x20;
* **Last Deployed At** - Displays the last deployed at date and time of the service with the given version.
* **DBOM** **Status**- On clicking the DBOM, it displays the list of services and artifacts connected to the given application and also the complete DBOM details of the application.&#x20;
* **Actions** - You can delete the version by clicking the three dots given in the **Actions** column.&#x20;

\ <br>


# Context Graph

The Context Graph page is a graphical representation of the application. The page is divided into two sections.

One section displays the application along with its associated services, the status of the deployments and DBOM details. The other section displays the Policy Map and Network Map of it.&#x20;

### To View Context Graph

* Navigate to **Applications** > **Context Graph**.

The Context Graph page is displayed as shown below:

<figure><img src="/files/vmhhxtC9HTS12WhWA3wQ" alt=""><figcaption></figcaption></figure>

The section on the left displays the application details in a linear format in layer representation.

<figure><img src="/files/l1T9OOI1yNSu7Jnc2nQg" alt=""><figcaption></figcaption></figure>

* **Application Layer** - This layer displays the application name along with its risk status.&#x20;
* **Service Layer** - This layer displays the names of all the services of the application.&#x20;
* **Deployment Layer** - This layer displays the deployments status (allowed, blocked or scanning) along with its risk status.&#x20;
* **Stage Layer** - This layer displays the DBOM status of the application along with its risk status.&#x20;

The section on the right, displays the policy and network map of the application.&#x20;

#### Policy Map

The policy map displays the complete set of policies added in the application.&#x20;

<figure><img src="/files/3DkclLII0PdcHaU5pGsJ" alt=""><figcaption></figcaption></figure>

You can select from the dropdown as to what policies need to be displayed.&#x20;

#### Network Map&#x20;

The network map represents the network flow within the VPC for the selected application. The map shows the flow from the Source, IGWS (Internet Gateways), Route Tables, Elbs (Load balancers), Ingresses and then to the service.&#x20;

<figure><img src="/files/eMI9b24kHBbHbVoYCRAh" alt=""><figcaption></figcaption></figure>

The section below the network map displays the available **Default Vulnerabilities** and **Suppressed Vulnerabilities** for the application in the network flow path.&#x20;

<figure><img src="/files/exn08E809NYE9T0sKT3v" alt=""><figcaption></figcaption></figure>

{% hint style="info" %}
A scroll bar is available in the Context Graph Map to ease the navigation.&#x20;
{% endhint %}


# Deployment Firewall

The Deployment Firewall page is a graphical representation of the deployments of the application. The page shows the deployment data for the selected service or all services of the selected application.&#x20;

You can select the timeline and services for which you want the data to be displayed from the **Show Data For** dropdown.&#x20;

The tabs below this show the count for **Scanning**, **Allowed** and **Blocked** deployments.&#x20;

<figure><img src="/files/HcPjko08bm2rNsnmqu1E" alt=""><figcaption></figcaption></figure>

The panels below this show the graphical representation of the deployment data and most frequent security issues.

<figure><img src="/files/VaTDtOUPnpHRMvUbpeSy" alt=""><figcaption></figcaption></figure>

At the bottom, the services available for the application are displayed along with the details of it.&#x20;

<figure><img src="/files/l5vvgVuVFr8NyXWPnh8l" alt=""><figcaption></figcaption></figure>

The Name, Artifact Version, Artifact, Open Issues, Deployed At time, Status and DBOM status of the services are displayed.&#x20;


# Policies

The policies page displays all the rules related to the application. You can view the list of rules for any given environment. The environment of the selected application is displayed on the top.&#x20;

<figure><img src="/files/MAvQzgDhHOTkYoBWrp76" alt=""><figcaption></figcaption></figure>

The following details of the policies are displayed:

* **Rule :** Displays the name of the rule.
* **Tag :** Displays the related tags for the rule. The tags indicate to which security the rules are complied with.&#x20;
* **Category :** Displays the category of the rule.&#x20;
* **Severity :** Displays the severity or impact of the rule namely **Major**, **Critical** or **Normal.**&#x20;
* **Action :** Displays whether the rule displayed is an **Alert** or **Prevent.** When the rule fails; if the deployment passes and an alert is generated it is termed as **Alert**. If the deployment is blocked and an alert is generated then it is termed as **Prevent**.&#x20;
* **Description :** Displays the description of the rule.&#x20;
* **Teams :** Displays the team or group to which the application belongs to.&#x20;
* **Status :** Displays whether the rule is enabled or disabled. You can **Enable** or **Disable** the rule for the selected application by clicking the **Status** radio button. If the rule is enabled, the status button is green in color.&#x20;

### To Enable / Disable Rules:

* Select the rule that you want to disable or enable for the application and click the **Status** button.  A popup appears showing the options **Save Changes** and **Discard**.

<figure><img src="/files/VY4EAvkT2u2ojUtlOvjO" alt=""><figcaption></figcaption></figure>

* Click **Save** to save the changes or **Discard** to omit the changes.&#x20;

### Bulk Edit&#x20;

You can enable or disable multiple policies at the same time using the **Bulk Edit** option.&#x20;

<figure><img src="/files/iAhw822gHzmHii7s7kNl" alt=""><figcaption></figcaption></figure>

* Select **Bulk Edit**.&#x20;
* Choose the rules for which you want to perform the action.&#x20;
* Select **Enable All** or **Disable All**.&#x20;

<figure><img src="/files/rz3Pp5fSop6ud1h1NJrz" alt=""><figcaption></figcaption></figure>

* Click **Save Changes**.&#x20;

The changes gets applied for all the selected policies.&#x20;

{% hint style="info" %}
The **Severity** and **Action** fields can only be changed at the global level. Only application owners can disable the rules from this screen if required.&#x20;
{% endhint %}


# DBOM

The DBOM or Delivery bill of actions and materials displays the details of the application lifecycle throughout, till it is deployed. It captures the end-to-end visibility into all artifacts and related actions taken (code analysis and scanning, dependency validation, approvals, etc.) for software delivery and deployment.

DBOM is an integral component of OpsMx Secure Software Delivery solutions. It enhances software delivery transparency and attestation, and gives visibility over continuous delivery and deployment.&#x20;

### Application View

The DBOM (Delivery Bill of Materials) for an application is a collection of all policies evaluated for the application, along with a number of services in which they failed or passed. It contains the different stages and their app-level risk status/score and the overall risk status of the application.&#x20;

Select **Application View** to view the DBOM details of the selected application.&#x20;

<figure><img src="/files/hCH8bwzQOOE6OdgRdfJI" alt=""><figcaption></figcaption></figure>

On clicking the **Service or Artifacts** tab, the available services and artifacts for the application are displayed.&#x20;

<figure><img src="/files/MQTMH9gWNtGZadVg3WGE" alt=""><figcaption></figcaption></figure>

On clicking **OSS Risk** tab, the OSS risk page for the application is displayed. You can view the available libraries for the given application and the related details of it.&#x20;

<figure><img src="/files/CXODzGAkbgNROrZ4u8Eq" alt=""><figcaption></figcaption></figure>

### Service View

The delivery bill of materials or DBOM for the services is a collection of all policies evaluated across all the deployments in an application, along with a number of services in which they failed or passed. It contain the different stages and their app-level risk status/score and the overall risk status of the application.&#x20;

Select **Service View** to view the DBOM details of all the services available for the selected application.&#x20;

<figure><img src="/files/BFX4HCjEMM6fRlZpd62a" alt=""><figcaption></figcaption></figure>

On clicking View SBOM tab, you can view the SBOM details of the selected services.

<figure><img src="/files/zXXHYura9o15HS56WHiI" alt=""><figcaption></figcaption></figure>


# Integrations

The Integrations page displays the list of all the available integrated tools for the selected application. The top panel displays the number of Source, Build, Artifact, Post Deploy, Cloud Service Provider, Cloud Security Posture Management and Other tools.&#x20;

On clicking each tab the available tools are displayed as shown below:&#x20;

<figure><img src="/files/QSFODchUrQXiEEFpyd5i" alt=""><figcaption></figcaption></figure>

You can connect any tool by clicking **+ New Account**.&#x20;

<figure><img src="/files/otXG5pPexsyObVHPzTEN" alt=""><figcaption></figcaption></figure>

Enter the details for the required fields and click **Save**.&#x20;

<figure><img src="/files/jwbKHIx0Uydq38KVhyVw" alt=""><figcaption></figcaption></figure>

The tool gets connected to the application.&#x20;


# View Active Deployments

The current deployments section is displayed at the bottom of the Application Status page and it displays the alerts count for each service individually.

### To View Active Deployments

* Navigate to **Application Status** > **Active Deployments**.

<figure><img src="/files/hIhEjYGC5CRxO9YmiB2I" alt=""><figcaption></figcaption></figure>

The active deployments section displays the following details of the deployments as given below:

* **Service :** Displays the name of the service.&#x20;
* **Version :** Displays the version of the service.
* **Artifact :** Displays the image that is currently deployed in the service.
* **Artifact Version** : Displays the version of the artifact.&#x20;
* **Deployed At :** Displays the time of the deployment of the service.
* **Vulnerability :** Displays the vulnerability count for the given service. The color code notifies whether the vulnerability is **Critical**, **High**, **Moderate** or **Normal**. On clicking the panel, the [Vulnerability Management](https://docs.opsmx.com/opsmx-secure-software-delivery-ssd-platform/user-guide/vulnerability-management) page is displayed that gives more details about the vulnerabilities.&#x20;
* **Open Security Issues :** Displays the alerts count for the given service. On clicking the panel, the [View Open Security Issues](https://docs.opsmx.com/opsmx-secure-software-delivery-ssd-platform/user-guide/view-security-posture/view-open-security-issues) page is displayed that gives more details about the security issues.&#x20;
* **OSS Risk :** The [OSS risk ](https://docs.opsmx.com/opsmx-delivery-shield-platform/user-guide/global-risk-management/oss-risk)displays the risk status of all the open source components available in the service.&#x20;
* **DBOM Status :** The DBOM or **Delivery Bill of Actions** is used to capture the details of the application lifecycle throughout, till it is deployed. On clicking **View**, the DBOM details page is displayed. See [DBOM](https://docs.opsmx.com/opsmx-delivery-shield-platform/user-guide/view-security-posture/application-security-posture/dbom) for more details.&#x20;


# View Deployment History

The deployment history section is displayed at the bottom of the Application Status page and it displays the deployment data of all the available services in a graphical representation. **Day**, **Week**, and **Month,** wise deployment data can be seen using the **Show Data** **For** filter. The period range for which you want to view the deployments history can also be customized using the **Custom range** option.

### To View Deployment History

* Navigate to **Application Status** > **Deployment History**.

<figure><img src="/files/lSiPydy7mnpF76nEEYgz" alt=""><figcaption></figcaption></figure>

The deployment history section displays the deployments that had occurred for the selected time period. The time period can be **Day View**, **Week View**, **Month View** or you can select **Custom range** and select the specific time period in the calendar displayed.&#x20;

<figure><img src="/files/Q1sFm9Cp56nKgpSgsKfp" alt=""><figcaption></figcaption></figure>

You can also select the Services for which you want to view the deployment history.&#x20;

<figure><img src="/files/HLHwtAxVumtTtTfbrQMb" alt=""><figcaption></figcaption></figure>

The deployments represented in the data graph are shown in different color codes to indicate the risk levels as shown below:

<figure><img src="/files/ImxHeHEN5wdqqt4cUEUA" alt=""><figcaption></figcaption></figure>

* **Green** - Low Risk Image
* **Yellow** - Medium Risk Image
* **Pink** - High Risk Image
* **Red** - Critical Risk Image&#x20;


# Vulnerability Management

The Vulnerabilities page displays the complete details of all the vulnerabilities identified in the applications. The page displays the following panels:

* [Vulnerability Prioritization](#vulnerability-prioritization)
* [Vulnerability Enrichment](#vulnerability-optimization)

### Vulnerability Prioritization

The vulnerability prioritization panel displays the vulnerabilities in the form of graphs. Vulnerabilities are given prioritization ranks based on Exploit Prediction Scoring System (EPSS), the Common Vulnerability Scoring System (CVSS), and the Knowledge of Exploit Vulnerability (KEV).

**EPSS**

EPSS is a predictive model that analyzes the risk level of the vulnerability being exploited in the future. It evaluates the complexity of exploitation, the existence of publicly available exploits, and the potential impact of an exploit. By analyzing these elements, EPSS assigns a score that indicates the risk level associated with a vulnerability.

**CVSS**

CVSS is a framework for assessing the severity of vulnerabilities. It provides a standardized method for evaluating vulnerabilities based on various metrics, such as exploitability, impact, and complexity. The CVSS score, ranging from 0 to 10, helps you to prioritize the response efforts by identifying the most critical vulnerabilities.

**KEV**&#x20;

KEV, or Knowledge of Exploit Vulnerability, refers to the availability of information about a vulnerability and its associated exploits. A high KEV indicates that detailed information about the vulnerability is publicly available, increasing the likelihood of exploitation. By considering KEV alongside EPSS and CVSS scores, you can gain a more comprehensive understanding of the risk posed by a vulnerability.

The vulnerabilities are ranked based on prioritization, into 6 types of categories as shown below:

<figure><img src="/files/gvwE2w9gAdNadIPUaLAY" alt=""><figcaption></figcaption></figure>

* **Priority 1+** - Top priority, these vulnerabilities are found in CISA's Known Exploited Vulnerabilities Database and is the real threat.&#x20;
* **Priority 1** - (Upper right quadrant) - Critical vulnerabilities which are most likely to be exploited. For a Vulnerability to be in Priority 1, CVSS score should be greater than 6 and EPSS score greater than 0.2.
* **Priority 2** - (Bottom right quadrant) - These vulnerabilities may cause serious impact and are much less likely to be exploited. For a Vulnerability to be in Priority 2, the CVSS score should be greater than 6 and EPSS Score should be less than 0.2.
* **Priority 3** - (Upper Left quadrant) - These vulnerabilities are more likely to be exploited but  would not cause serious impact. For a Vulnerability to be in Priority 3, the CVSS score should be less than 6 and EPSS Score should be greater than 0.2.
* **Priority 4** - (Bottom Left quadrant) - These vulnerabilities are less likely to be exploited and would not cause serious impact. For a Vulnerability to be in Priority 4, the CVSS score should be less than 6 and EPSS Score should be less than 0.2.
* **Unprioritized** - Vulnerabilities which are not categorized by the above 5 types of Priorities are considered as unprioritized.

{% hint style="info" %}

* You can download the vulnerability data as .json, .pdf or .csv files.&#x20;
  {% endhint %}

### Vulnerability Enrichment

The vulnerability enrichment panel displays the vulnerabilities that are of exploitation, automatable and technical impact category.&#x20;

<figure><img src="/files/WPcDuZXaj4WjUMrxfxn7" alt=""><figcaption></figcaption></figure>

### Top 5 Vulnerabilities

The **Top 5 Vulnerabilities** tab on expanding, displays the list of 5 most critical and prioritized vulnerabilities for the selected application along with their CVSS value.&#x20;

<figure><img src="/files/nd4Hnlbfoc4EUfim2z1J" alt=""><figcaption></figcaption></figure>

<figure><img src="/files/2wzHS8K2l8Q02NFC8nvJ" alt=""><figcaption></figcaption></figure>

### Vulnerability Deduplication

To avoid duplication of vulnerabilities, components impacted with the same CVE are grouped and displayed.&#x20;

In the example shown below, components that are impacted by CVE-2024-22262 are grouped under it.&#x20;

<figure><img src="https://lh7-us.googleusercontent.com/docsz/AD_4nXe-HCwrB3gZBS7S-eTaXTGEkJexoS6CSruOP0OkX6PGrPI0JJtdlI1q1fh92wWzFuiriR4qisklY9V0Z2gJbVq_Bdf6vnpWmUkxGEUf2cr22GwwZNCUZARGZOwyNiWTpfOKAsvYxV74c1RLfSAB84Ob1j9W?key=RK3SZlo7OVlIiJdDiuxpwQ" alt=""><figcaption></figcaption></figure>

On clicking the CVE, a popup is displayed. The **Show impacted components** section displays the total number of components impacted by the selected CVE.

<figure><img src="/files/XzSmeGUgJmfjKxQvkctg" alt=""><figcaption></figcaption></figure>

By expanding this section, all the components that are impacted are displayed as shown below:

<figure><img src="/files/EmUYUH3FDiNlSYhjvg6x" alt=""><figcaption></figcaption></figure>

### JIRA Automation

JIRA tickets are automatically created and also can be manually created for the vulnerabilities. If the vulnerability with security issue is of Critical or High severity, the Jira is automatically created and for other severities you can create manually by using the **Create Jira Ticket** option in the vulnerabilities details popup.&#x20;

#### Creating JIRA Ticket

To create JIRA tickets, follow the steps given below:&#x20;

* Expand the **Show impacted components** drop down. The list of all the components impacted by the selected vulnerability are displayed.&#x20;

<figure><img src="/files/zIN4FP0jy8ACvjRzdaVY" alt=""><figcaption></figcaption></figure>

* Click the **Actions** column.

<figure><img src="/files/g1gZcoWggq6Xtb5kXSk0" alt=""><figcaption></figcaption></figure>

* Click the **Create Jira Ticket** option.&#x20;
* An option to create the Jira ticket is displayed. Click **Create**.&#x20;

<figure><img src="/files/FzmWuwQx4G4a9acOBSBh" alt=""><figcaption></figcaption></figure>

### Smart Search

The smart search option in the Vulnerabilities details page is used to search for specific components based on Artifact, Component, Severity or Vulnerability.&#x20;

* Click in the **Search** dropdown. The available search options are displayed.

<figure><img src="/files/UaU69fVQLv5gZohUpDO3" alt=""><figcaption></figcaption></figure>

* Select the required option. A dropdown with the values specific to the selected option are displayed. For example: Vulnerability is selected as the search option as shown below:

<figure><img src="/files/M2eqGElCRx3olylf7Tkn" alt=""><figcaption></figcaption></figure>

* Select the specific vulnerability value for which you want to find the components, and press **Enter**. The components with the selected vulnerability are displayed.&#x20;

<figure><img src="/files/qJrRFvt8gOluebHWupUu" alt=""><figcaption></figcaption></figure>

* The displayed vulnerability page can be downloaded in either .CSV or .JSON or PDF formats by clicking the **Download** button provided at the top right corner as show below:

<figure><img src="/files/8ZnjlVOuZ7ruAFYEbEmH" alt=""><figcaption></figcaption></figure>

The vulnerabilities can be searched from the Application Dashboard page also. The following example shows searching for the applications based on the **Vulnerability** in this page.

* Select **Vulnerability** from the search dropdown. Now enter the vulnerability name as shown below and press **Enter**. The applications with the given vulnerability are displayed.&#x20;

<figure><img src="/files/8M1oZPJqO99PkRfWLhJK" alt=""><figcaption></figcaption></figure>

* Select a application and click it. The environment in which the vulnerability is found is highlighted and the current deployments with the selected vulnerability are displayed as shown below.&#x20;
* Click on any **Vulnerability** count for the displayed active deployments.&#x20;

<figure><img src="/files/mYrznjoxLWwOlv7ATgrB" alt=""><figcaption></figcaption></figure>

* The vulnerabilities details page is displayed. Click search and select **Vulnerability** from the search options.&#x20;
* Now select the same vulnerability name from the displayed list. All the components related to the selected current deployment are displayed. &#x20;


# Global Risk Management

Global risk management page displays the OSS Risk status and the Cloud Security for the given applications.

* OSS Risk
* Cloud Security


# OSS Risk

The OSS Risk page analyzes the risk posture of open-source components within the codebase and deployment artifacts. The Global Risk page displays the risk status of the various open-source components found in the discovered artifacts. Detailed insights and assessments of the findings are displayed on this page for better visibility and management.

### To View OSS Risk&#x20;

* Navigate to Global Risk Management > OSS Risk. The OSS Risk status page is displayed as shown below:

<figure><img src="/files/Q2LdKl4kTXubHizyQ7nz" alt=""><figcaption></figcaption></figure>

The top panel displays the following details:

* **Risk Distribution** - Displays the risk status count of all the identified libraries.&#x20;
* **License Distribution** -  Displays the license distribution count of all the identified  libraries. &#x20;

The grid below displays the following details of the OSS libraries:

<figure><img src="/files/TwsOJrlrzE6dKfwfawsI" alt=""><figcaption></figcaption></figure>

* **OSS Library -** Displays the name of the open source library.&#x20;
* **Risk Status** - Displays the risk status of the OSS library, namely; Apocalypse, Critical, High, Medium, Low and Unknown.&#x20;
* **Stars** - Displays the number of users who have bookmarked the library.&#x20;
* **Forks** - Displays the number of times the library has been copied or cloned by the users.&#x20;
* **Number of CVEs** - Displays the number of CVEs (Common Vulnerabilities and Exposures) for the library.&#x20;
* **Mean Time to Repair** - Displays the average time taken for the issues reported to be fixed.&#x20;
* **License Type** - Displays the license type for the given library, namely; Forbidden, Restricted, Reciprocal, Notice, Permissive, Unencumbered and Unknown. E.g., MIT, Apache, BSD, GNU - GPL, LGPL. MPL etc.
* **Copyrights** - Displays the copyright information for the given license.&#x20;
* **Impacted Repository** - Displays the link of the repository that is impacted by the risk.&#x20;
* **Source** - Displays the source name of the impacted repository.&#x20;
* **Copyrights** - Displays the copyrights of details of the license type.&#x20;
* **Actions** - On clicking the **View License Rollup** option that is displayed, you can view the **License Rollup** for the selected OSS Library.&#x20;

On expanding the individual OSS library, the details of the OSS library pacakge such as PURL (packge URL), Component version, Artifact tags are displayed.&#x20;

<figure><img src="/files/h6gTSAYocS11CaMMcZzN" alt=""><figcaption></figcaption></figure>

### To Download the details

* You can download the details shown in the page in .json or.csv format by clicking the **Download** button.
* You can download the details as a PDF by clicking the **Report** button.&#x20;

<figure><img src="/files/ikSQ135UX1s07ZpM4A09" alt=""><figcaption></figcaption></figure>

### To View the License Rollup

The license rollup page that displays the complete license details for the OSS packages for each OSS library can be accessed from the View License Rollup option.&#x20;

* Click the three dots in the Action column > View License Rollup.&#x20;

<figure><img src="/files/CXozjDF7ppqj5Q5lJp7M" alt=""><figcaption></figcaption></figure>

### To View Reports

The details of the OSS library and other details can be downloaded in PDF form.&#x20;

* Click the **Report** button. The report is downloaded.&#x20;

<figure><img src="/files/hLYIb2vAq6gj5OpSHrOq" alt=""><figcaption></figcaption></figure>


# License Rollup

The License Rollup page displays the complete license details for the OSS packages. It displays the **License Name**, **License Category** and **Component Count**.&#x20;

<figure><img src="/files/L1mny7w2TCdbzdIkR00q" alt=""><figcaption></figcaption></figure>

* **License Name** - The name of the licenses associated with the OSS library.&#x20;
* **License Category** - The category of the displayed license.&#x20;
* **Component Count** - Number of components having the same license.&#x20;

{% hint style="info" %}
You can download the details of the page as a .json or .csv file using the **Download** button.&#x20;
{% endhint %}


# Cloud Security

The **Cloud Security Risk Summary** page provides a consolidated view of security findings across the cloud services for a selected account. It helps users quickly assess risk distribution and identify services requiring immediate attention.

## To Access Cloud Security

Navigate to **Global Risk** > **Cloud Security**.

The top panel displays the metadata related to the executed scan:

<figure><img src="/files/gWwhjZ2cOKmrcx78CEMp" alt=""><figcaption></figcaption></figure>

* **Account -** Indicate the cloud account on which the scan is performed.
* **Trigger Type -** Indicates how the scan was initiated (e.g., AWS integration).
* **Triggered By -** Indicates whether the user or system that initiated the scan.
* **Scan Date -** Indicates the timestamp of when the scan was executed.&#x20;

The column below displays the details of the cloud services evaluated during the scan.

<figure><img src="/files/nAu7SDNqwS6d4YpNQBzY" alt=""><figcaption></figcaption></figure>

* **Services** - Displays the name of the cloud service evaluated during the scan.&#x20;
* **Resources** - Displays the number of resources evaluated during the scan.&#x20;
* **Rules** - Displays the number of security or compliance rules applied to evaluate the resources within each service.
* **Summary** - Displays the number of security alerts identified during the scan.&#x20;


# Code-to-Cloud Security & Scanners Overview

Code-to-Cloud Security & Scanners represent OpsMx Delivery Shield's unified approach to securing modern applications across the **entire software delivery lifecycle** — from the first line of code written by a developer to the runtime behavior of a deployed workload in production.

As organizations adopt cloud-native architectures, microservices, containers, and AI-driven development, the attack surface expands significantly. Siloed security practices — scanning code here, checking images there, monitoring production separately — leave dangerous gaps between stages. Code-to-Cloud Security closes these gaps by embedding continuous, integrated security validation at every stage of delivery.

{% hint style="info" %}
**Code-to-Cloud Security is not a product feature — it is the organizing principle of OpsMx Delivery Shield. Every scanner, every policy, and every gate works together as a single, closed-loop security model from code commit to cloud runtime.**
{% endhint %}

## Why Code-to-Cloud Security in OpsMx

Traditional security approaches treat each stage of delivery as a separate concern — developers run SAST, ops teams manage runtime monitoring, and security teams conduct periodic audits. In a world where CI/CD pipelines release code dozens of times per day across dozens of microservices, this model cannot keep up.

OpsMx Delivery Shield uses the Code-to-Cloud model to:

* **Eliminate security blind spots** between development, build, deployment, and runtime
* **Create a continuous feedback loop** — where runtime anomalies inform earlier-stage code and build controls
* **Enforce consistent policy** across all stages — from source code to cloud infrastructure to live AI systems
* **Scale security with DevOps velocity** — automated, integrated checks that run in the background without blocking teams
* **Address AI-era threats** — securing not just traditional software but AI-generated code, LLM endpoints, and autonomous agents

## Security Coverage — Stage by Stage

| Stage                | What Gets Secured                      | Key Capabilities                                  |
| -------------------- | -------------------------------------- | ------------------------------------------------- |
| **Code**             | Source code, dependencies, secrets     | SAST, SCA, Secrets Detection                      |
| **AI Development**   | AI-generated code, notebooks, prompts  | AI Code Analysis, NBDefense, MCP Security         |
| **Build & Artifact** | Container images, binaries, packages   | Container Image Scanning, Artifact Scanning, SBOM |
| **Deploy**           | IaC, Kubernetes manifests, Helm charts | IaC Scanning, Kubescape, Deployment Firewall      |
| **Cloud**            | Cloud infrastructure configurations    | CSPM, ScoutSuite, Cloud Custodian                 |
| **Runtime**          | Live workloads, APIs, AI systems       | Runtime Signals, Drift Detection, DAST, Garak     |


# Code Security

Code Security is the **foundational, first line of defense** in OpsMx Delivery Shield's Code-to-Cloud model. It identifies and mitigates vulnerabilities directly within source code — before they propagate into build pipelines, container images, or production systems where remediation becomes exponentially more expensive and complex.

In modern DevOps environments, development teams push code changes continuously through automated CI/CD pipelines. Without robust code security practices embedded at this stage, vulnerabilities — insecure coding patterns, exposed secrets, dependency risks, logic flaws — can easily slip into production undetected.

{% hint style="info" %}
Code Security ensures that security is an integral part of development — not a post-deployment checkpoint.
{% endhint %}

## What Code Security Covers in OpsMx

OpsMx Delivery Shield's Code Security layer goes beyond traditional static analysis. It combines multiple scanning techniques to provide comprehensive visibility into both custom-written code and third-party dependencies:

| Technique                                      | What It Catches                                                                               |
| ---------------------------------------------- | --------------------------------------------------------------------------------------------- |
| **SAST (Static Application Security Testing)** | Insecure coding patterns, injection risks, unsafe API usage — in source code before execution |
| **SCA (Software Composition Analysis)**        | Known CVEs in open-source libraries and third-party dependencies                              |
| **Secrets Detection**                          | Hardcoded API keys, tokens, passwords, and credentials accidentally committed to repositories |
| **License Compliance**                         | Open-source license violations that create legal or compliance risk                           |
| **AI-Generated Code Analysis**                 | Security risks in code produced by AI coding assistants                                       |

## Why Code Security Is Used in OpsMx

The cost of fixing a vulnerability at the code stage is estimated to be **10x–100x lower** than fixing the same vulnerability in production. OpsMx uses Code Security in Delivery Shield to:

* **Shift security left** — embedding checks directly into developer workflows, PR reviews, and CI pipelines — catching issues where they originate, not where they manifest
* **Unify multiple scanners** — Semgrep, SonarQube, Opengrep, Trivy, and Grype all feed into a single dashboard, eliminating tool fragmentation
* **Enforce governance at the code level** — policy-based gates block insecure code from progressing through the pipeline
* **Reduce remediation cost and rework** — developers receive inline findings with actionable fix guidance, not a report delivered weeks later
* **Establish the security baseline** for every downstream stage — container security, runtime protection, and cloud security all build on top of what Code Security establishes at the source

### Key Capabilities in Delivery Shield

**Automated CI/CD Integration**

Code Security checks trigger automatically at pull request creation, merge, and build — giving developers real-time feedback in the tools and workflows they already use: GitHub Actions, GitLab CI, Jenkins, and more.

**Policy-Based Gate Enforcement**

Using the OPA Policy Engine, organizations define which vulnerability severities, license types, or secret patterns constitute a blocking condition — automatically preventing non-compliant code from advancing through the pipeline.

**Unified Findings Dashboard**

All Code Security findings — across SAST, SCA, secrets, and license checks — are unified in the Delivery Shield Vulnerability Management page. Developers see a single, prioritized list of issues to fix, not fragmented reports from five different tools.

**Risk-Based Prioritization**

Findings are prioritized by severity, exploitability, and business context — so developers focus on what poses the highest actual risk, not just the longest CVE list.

### Benefits for the User

* **Fix issues in the IDE, not in production** — security findings appear at the earliest possible moment in the developer workflow
* **No tool-switching** — all Code Security results are visible in Delivery Shield alongside artifact, cloud, and runtime findings
* **Developer-friendly guidance** — every finding includes actionable remediation steps, not just severity labels
* **Compliance evidence built in** — code-level findings are logged, traceable, and exportable for audit purposes


# SAST

Static Application Security Testing (SAST) analyzes your application's source code **before it runs** — catching vulnerabilities, coding flaws, and security misconfigurations early in the development cycle, before they reach production.

OpsMx Delivery Shield natively integrates with CI/CD tools such as Jenkins, GitHub Actions, and GitLab. As and when any stage in the CI/CD pipeline is triggered, automated security scans defined within those stages are also triggered by OpsMx.

## How It Works

OpsMx SAST leverages open-source tools Semgrep and SonarQube to provide lightweight, fast, and customizable static analysis designed for developers and security professionals.

When a pipeline stage is triggered, Delivery Shield:

1. **Connects** to your repository via the integrated CI/CD tool
2. **Scans** the source code using Semgrep and/or SonarQube rule sets
3. **Analyzes** findings against your defined security policies
4. **Reports** vulnerabilities categorized by severity and confidence
5. **Blocks or flags** the release depending on your policy configuration

## Viewing SAST Results

Once a scan completes, results are available in the **Delivery Shield dashboard**:

* Navigate to your **Application** → **Source Scan** section
* View findings organized by **severity** (Critical, High, Medium, Low) and **confidence level**
* Drill into individual findings to see the affected file, line number, and rule triggered
* Track remediation status across environments from a **centralized view**

{% hint style="info" %}
SAST scan findings are also incorporated into your **application's overall security score** and reflected in the Delivery Bill of Materials (DBOM).
{% endhint %}

## Remediation

When vulnerabilities are detected, Delivery Shield provides:

* **Inline suggestions** with remediation guidance per finding
* **AI-powered remediation** — the ability to generate recommendations for upgrading insecure dependencies and suggest alternatives to vulnerable libraries.&#x20;
* **Automated pull requests** to apply fixes directly in the repository (where configured)

## Supported Languages & Frameworks

SAST in Delivery Shield supports 20+ programming languages including Python, JavaScript, Java, Go, and Ruby, with framework-specific rules for React, Flask, and Django, plus a rich library of rules from the open-source community.


# How to do Source Scan

The Source Scan, scans both public and private repositories from the Git and Bitbucket. The scanning process includes SAST (Static Application Security Testing), code license verification, secret detection, and component analysis.

By integrating OpsMx Delivery Shield with your Bitbucket repository, you gain continuous, automated source code scanning that enhances the security of your software delivery pipeline. Regular scans, detailed reporting, and advanced features like CI/CD integration ensure that your software is built with security in mind from the very beginning.

This page explains the process of Source Scan for **Bitbucket** repository.&#x20;

* Before starting with the scan, you need to integrate Bitbucket with the OpsMx platform. Follow the steps provided in [Integrating BitBucket](https://docs.opsmx.com/opsmx-delivery-shield-platform/getting-started/integrating-ci-and-cd-tools-in-delivery-shield/bitbucket) to complete the process.&#x20;
* Once the Bitbucket integrator is connected to OpsMx you can start with the source scan.&#x20;

### To Access Source Scan&#x20;

* Click on **Scan Now** button at the top right corner of the screen.

<figure><img src="/files/KEeUIuLWTexDEX2JBuGV" alt=""><figcaption></figcaption></figure>

* In the screen that appears, select **Source Scan** from the left panel.

<figure><img src="/files/23G429FLA1YS0XuOpS1w" alt=""><figcaption></figcaption></figure>

Now you can **Add Project, Upload Project** or **Sync Project** to proceed with the scan.&#x20;

### To Add a Project&#x20;

* To add or update a new project with source scan configurations, for scanning, click **Add Project**.&#x20;
* The **Create Project** details page is displayed as shown below. Enter the details for the following fields:

<figure><img src="/files/KFmHHZ6f6D9xQMNaLd4R" alt=""><figcaption></figcaption></figure>

* **Name** : Enter a name for the project.&#x20;
* **Team** : Select the team for which you want to create the project.&#x20;
* **Scan Type** : The default type is Source Scan.&#x20;
* **Platform** : Select the platform type, the platform where the code resides (Github, Gitlab Server, Bitbucket, Bitbucket Server, Azure, Azure Server) for the project.
* **Account** : Choose the needed account that has been integrated for the selected platform. If no account is available for the selected platform then click **Add Account**.
  * The integration page is displayed. You can add a new account.&#x20;
* **Organization / Workspace** : Choose the organization or workspace that the selected account has access to.&#x20;
* **Scan Level** : Select the scan level; either organization level or repository level that needs to be scanned.&#x20;
* **Configuration** : Set the configuration details, and schedule the auto scan time.
  * **Repo /Project** : Select the repo or project name for which the scan needs to be executed.&#x20;
  * **Branch** :  Select the branch name for which the scan needs to be executed.&#x20;
  * **Branch Pattern** : Select the branch pattern for which the scan needs to be executed.&#x20;
  * **Scan Upto** : Select the branch limit for which the scan needs to be executed. (number of branches to be scanned)
  * **Schedule Auto Scan** :  Select the time range during which the scan needs to be rerun automatically.&#x20;
* Click Save.&#x20;

The project gets added for scanning.

### To Upload a Project

* To upload a project from your local, for scanning, click **Upload Project**.

<figure><img src="/files/HcMI4eAfLkeIYqbBlKVb" alt=""><figcaption></figcaption></figure>

* Click **Upload File** and select the json file that you want to add for scanning. &#x20;

<figure><img src="/files/IpQviTCNIyjgVQt5Iedm" alt=""><figcaption></figcaption></figure>

* Click **Save**.&#x20;

<figure><img src="/files/HDdpi87rWfnLEfu6M0bs" alt=""><figcaption></figcaption></figure>

The file gets added for scanning.

### Saving Configuration &#x20;

* After adding the configuration details you can click the **Save Configuration** option to save the adding details and trigger the scan at a later period. &#x20;

<figure><img src="/files/1moJLFD7MqMCnmRnq0Vc" alt=""><figcaption></figcaption></figure>

* The added project displays in the list with a **Paused** scan status.

<figure><img src="/files/rnMvKubS6dHkFmiMJ7LY" alt=""><figcaption></figcaption></figure>

* When you want to scan the saved project you can click the Trigger Scan option to initiate the scan.

<figure><img src="/files/E2HRL0ZURKTZz3vilGVf" alt=""><figcaption></figcaption></figure>

### To Integrate JIRA at Project Level

JIRA can be integrated at project level to create tickets whenever an alert is identified.&#x20;

* To integrate JIRA, click the Integrations icon on expanding the project.&#x20;

<figure><img src="/files/D87SrN8JKJlZ7rfSXbON" alt=""><figcaption></figcaption></figure>

* The JIRA integration page is displayed. Click **Add Account** and enter the details.&#x20;

<figure><img src="/files/zfsM6BarJXhWpjlfjjR2" alt=""><figcaption></figcaption></figure>

* Enter the values for the following fields:
  * **Account Name -** Enter the JIRA account name.&#x20;
  * **Jira Project Key -** Enter the name of your Jira project.&#x20;
  * **Jira** **URL -** Enter your Jira host Url&#x20;
  * **Jira Email Id -** Enter the username to access Jira.&#x20;
  * **Token -** Enter the password / token for the Jira account.&#x20;
  * Enable **Automatically create Jira tickets during the scan** to create JIRA ticket to the team owner when the alerts are identified.&#x20;
  * **Trigger Type** - Indicates at which level Jira tickets should be created.&#x20;
    * **Create Jira ticket at the Component Alert level** - Jira tickets will be created for each individual impacted component.&#x20;
    * **Create Jira ticket at the Deduplication Alert level** -  A single Jira ticket will be created for all the impacted components.&#x20;
    * **Creation Scope** - If Vulnerabilities is selected, Jira is created only for Critical and High alerts. If All Policies is selected Jira is created for all alerts.&#x20;
  * Enable **Assign the Jira ticket to the Team owner** if you want to assign the ticket to the team owner.&#x20;
  * **Fields -** Enter the labels that need to be added in the created Jira ticket.&#x20;
  * **Values -** Enter the values that need to be given in the Jira ticket. The given variables are replaced with actual values when the tickets are created.&#x20;
  * **Status Keyword Mapping** - You can set the keywords for the status.&#x20;
* Click **Test** to check if the entered values are valid.
* Once validated, click **Save**. The tool is connected.

### To Sync Project

To Sync a project, for scanning, you can either sync it from Argo GitHub repository to SSD or add the project details in code format.&#x20;

#### Syncing Projects from Argo Github Repository

In a regular working instance of SSD with argo setup, create config map with name adhoc-project-cm and sync it with argo github repository. The YAML file name should be project.yaml.

The below example is a sample file that can be synced using argo. When synced this will create a config map with name adhoc-project-cm with project.yaml file containing one sample project

```
apiVersion: v1
kind: ConfigMap
metadata:
  name: adhoc-project-cm
data:
  project.yaml: |
    - name: bitbucket-ws1
      scanType: sourceScan
      platform: bitbucket
      accountName: bitbucket
      teamName: default
      scanLevel: repoLevel
      organisation: OpsMx
      type: organisation
      projectConfigs:
        - repository: docker-swarm
          scheduleTime: 0
          branch:
            - main
          branchPattern: ''
          scanUpto: 1
        - repository: issue-generator
          scheduleTime: 0
          branch:
            - fixes
            - grype
            - main
          branchPattern: ''
          scanUpto: 3
```

The following account names must be given by the user.

* Org level integrator account name: “dev”
* Team level integrator account name: "dev (\<team-name>)",&#x20;
* Env level integrator account name: "dev (\<team-name>) \[\<env-name>]",

```
kubectl apply -f project.yaml -n <namespace>
```

#### Syncing Projects in Code Format&#x20;

To Sync projects in code format add the project details int he given format below:

```
[
  {
    "name": "bitbucket-ws",
    "scanType": "sourceScan",
    "platform": "bitbucket",
    "accountName": "bitbucket",
    "teamName": "default",
    "scanLevel": "repoLevel",
    "organisation": "OpsMx",
    "type": "organisation",
    "projectConfigs": [
      {
        "repository": "docker-swarm",
        "scheduleTime": 0,
        "branch": [
          "main"
        ],
        "branchPattern": "",
        "scanUpto": 1
      },
      {
        "repository": "issue-generator",
        "scheduleTime": 0,
        "branch": [
          "fixes",
          "grype",
          "main"
        ],
        "branchPattern": "",
        "scanUpto": 3
      }
    ]
  }
]

```

### To View and Interpret Scan Results&#x20;

Once the scan is complete, OpsMx generates the overall results and they are displayed as shown below: <br>

* Repos Registered
* Total Branches
* Total Scans
* Total Projects
* Auto Scan Enabled Repos

<figure><img src="/files/5iT3oTn1kbuRTpTORhYh" alt=""><figcaption></figcaption></figure>

The panel at the bottom displays the project details. On expanding each project you can view the complete details of it.

{% hint style="info" %}
The current status of the scan (completed, pending or failed) is displayed to notify the status of the project.&#x20;
{% endhint %}

* To edit the configuration details of the project, click the **Edit Configuration** button.&#x20;
* Click the **View** option in the **Action** button, to view the scan results of the project.&#x20;

<figure><img src="/files/Trxwxmlwnn0xW4wx9XCO" alt=""><figcaption></figcaption></figure>

* The results page displays the complete data of the scan details.&#x20;
  * On clicking the **Download** button, the scan results are downloaded in .json or .csv format.
  * On clicking Report, the scan results are downloaded in a report format.&#x20;
  * On clicking Go to Artifact Page, you are redirected to the related artifact page.&#x20;

<figure><img src="/files/xYGeD7FNoEyXFmUtpAQW" alt=""><figcaption></figcaption></figure>

### Quick Actions

Each project displays 5 quick action buttons as shown:

<figure><img src="/files/69TarDn8T8llapok7H5Y" alt=""><figcaption></figcaption></figure>

1. **Trigger Scan** – Initiates a new scan for the project or runs a scan using a previously saved configuration.
2. **Integrations** – Opens the project's **Integrations** page, where all available integrations for the project are listed.
3. **Policies** – Displays the list of policies that have been configured for the project.
4. **Edit Project** – Opens the project configuration settings, allowing you to modify the project's details and scan settings.
5. **Delete** – Removes the project from the system.

### Best Practices

To get the most out of OpsMx Delivery Shield Source Scan, consider following these best practices:

* **Frequent Scanning**: Run the scans regularly (e.g., after each commit or weekly) to detect the vulnerabilities early.
* **CI/CD Pipeline Integration**: Incorporate source scanning into your continuous integration/continuous deployment pipeline to identify the issues before they go live.
* **Alerts and Notifications**: Set up alerts to notify your team when critical vulnerabilities are detected, to address them promptly.
* **Fixing Issues in Advance**: Address vulnerabilities as soon as they are found to prevent issues from piling up.

### Troubleshooting

If you encounter any issues during or after the scan, check the following:

* Connection Issues with Bitbucket:
  * Ensure that the correct authentication methods (OAuth, API tokens, SSH) are set up properly.
  * Verify that the OpsMx account has the necessary permissions to access the Bitbucket repository.
  * Check for bitbucket url whitelisting in supplychain api configmap

<br>


# AI Remediation

Automated workflow is integrated into Scan Now, enabling security vulnerabilities identified by OpsMx Delivery Shield (DS) during the Software Development Life Cycle (SDLC) to be automatically routed to OpsMx AI Guardian (AIG) for remediation. This integration focuses on code-level fixes for Static Application Security Testing (SAST) and Software Composition Analysis (SCA) findings in supported languages such as Java and Go, helping accelerate the Mean Time to Remediate (MTTR).

### To Enable AI-Based Remediation Details

AI Remediation is integrated in the Scan Now option.&#x20;

1. Expand the project for which you want to view the remediation details.&#x20;
2. Click **Open Issues** to view the list of alerts.&#x20;

<figure><img src="/files/81Yfo5MHt22pqUQHq4oq" alt=""><figcaption></figcaption></figure>

3. From the alerts list, select the required alert.

<figure><img src="/files/CfxUuwD4p6lXBvtZD6Ze" alt=""><figcaption></figcaption></figure>

4. Navigate to the **Impacted Components** section and click on it.
5. In the list of applications, identify the relevant application and click **Remediate**.

<figure><img src="/files/WBeNueu8GkfIXl93QYVa" alt=""><figcaption></figcaption></figure>

The AI Remediation window is displayed. It analyzes the selected alert and provides a detailed summary of the issue, recommended remediation steps and possible workarounds.&#x20;

<figure><img src="/files/4CuuUFztzaA7F711TXEv" alt=""><figcaption></figcaption></figure>

{% hint style="info" %}
AI Remediation is supported only for repositories hosted on GitHub Cloud. Remediation is performed only when the source details of the associated artifacts or projects are available.
{% endhint %}


# SAST Findings

In the scan details page you can view the SAST findings associated with the selected scan.&#x20;

1. Click **View** to open the **Scan Details** page.
2. Navigate to the **SAST** tab to view the related SAST findings and details.
3. You can choose between Opengrep or Semgrep tool to view the related scan details.&#x20;

<figure><img src="/files/yHM8GZ71foBnTjNR3zSY" alt=""><figcaption></figcaption></figure>

3. Click **Report** to download the findings as a report.
4. Click **Download** to export the scan details.

<figure><img src="/files/LvjaLwJxMuyrb16MGMj1" alt=""><figcaption></figcaption></figure>

4. You can download the Semgrep tool findings or Opengrep tool findings or both details by clicking the relevant option.&#x20;

<figure><img src="/files/62t64EFt2OjNjuJZMZP7" alt=""><figcaption></figcaption></figure>

4. On clicking **Go to Artifact Page**, the Source Scan Artifacts page for the related scan is displayed.&#x20;

<figure><img src="/files/Y1drMgphy2p2kPvg1hps" alt=""><figcaption></figcaption></figure>


# SCA

Software Composition Analysis (SCA) identifies and assesses security risks hidden inside the **open-source libraries, third-party packages, and external dependencies** that your application is built on — before those risks reach production.

Modern applications draw heavily from open-source components. When any one of those components carries a known vulnerability — such as Log4Shell, OpenSSL, or a compromised GitHub Action — every application using it is exposed. SCA solves this by continuously scanning your dependency tree, flagging vulnerabilities with severity context, checking license compliance, and feeding results into the unified Delivery Shield security posture view.

OpsMx Delivery Shield is powered by leading open-source vulnerability scanners — Trivy and Grype — to give insights into the security posture of open-source and third-party libraries and dependencies. Developers and security teams can identify vulnerabilities and license issues across the software supply chain and boost AppSec.

## How SCA Works in OpsMx Delivery Shield

When a scan is triggered — via a pipeline stage, scheduled scan, or ad hoc request — Delivery Shield:

1. **Discovers** all open-source libraries, packages, and dependencies in the target — including transitive dependencies
2. **Scans** using Trivy and Grype against multiple vulnerability intelligence databases
3. **Scores** findings by severity (Critical, High, Medium, Low) using CVSS scoring
4. **Evaluates** license compliance against your organization's policy
5. **Reports** results across three locations in the dashboard — the **Vulnerability Management page**, the **Artifact section of the DBOM page**, and the **View Open Security Issues page**
6. **Calculates** the overall security status of the image and application using Grype scan results
7. **Triggers** AI-powered remediation suggestions or automated pull requests where configured

Delivery Shield also triggers periodic vulnerability scans on deployed images — not just at build time — ensuring your production environment stays continuously evaluated as new CVEs are published.

## What SCA Scans

SCA in Delivery Shield provides comprehensive coverage across the ecosystem — container images, file systems, Git repositories, and Infrastructure as Code (IaC).&#x20;

| Scan Target                      | Description                                                                                   |
| -------------------------------- | --------------------------------------------------------------------------------------------- |
| **Container Images**             | Scans all layers of a container image for vulnerable OS packages and application dependencies |
| **Git Repositories**             | Scans source code repositories for open-source dependency vulnerabilities                     |
| **File Systems**                 | Scans build artifacts and file systems for dependency risks                                   |
| **Infrastructure as Code (IaC)** | Identifies vulnerable dependencies and misconfigurations in IaC configurations                |
| **AI-Generated Code**            | Scans dependencies introduced by AI code generation platforms for known vulnerabilities       |

## Key Capabilities

**Automated Scanning in CI/CD**

Delivery Shield integrates into CI/CD pipelines and automatically scans for vulnerabilities, enforcing compliance policies during development and build stages. Security checks prioritize and remediate issues on the basis of risk severity.&#x20;

**Continuous Deployed Image Monitoring**

Beyond build-time scans, Delivery Shield also triggers periodic vulnerability scans on deployed images — so newly published CVEs are caught even on already-running workloads, without waiting for the next pipeline run.&#x20;

**License Compliance Enforcement**

OpsMx Delivery Shield ensures that all open-source components comply with your organization's licensing policies, preventing legal complications. Automating license verification improves developer productivity and catches issues that may be missed by manual reviews.&#x20;

**Real-Time PR & Merge Gate Security**

During pull requests, Delivery Shield provides real-time feedback helping reviewers identify potential security risks and ensuring only secure code is approved and merged. While merging code, Delivery Shield ensures that code being merged into the main branch meets your organization's security standards.&#x20;

**SBOM Generation & Import**

SSD imports SBOMs generated by Trivy and analyzes them to identify supply chain security issues. SBOM outputs are available in **CycloneDX** and **SPDX** formats for compliance and audit submissions.&#x20;

**Policy-Based Deployment Blocking**

Delivery Shield's SCA flags usage of vulnerable dependencies in real-time, preventing workflows from unknowingly executing malicious or vulnerable code. Combined with the Policy Engine (OPA), high-severity findings can automatically block a release from proceeding.

## Viewing SCA Results

SCA scan results can be viewed in the following pages within Delivery Shield:

* **Vulnerability Management page** — full findings list with severity, CVE ID, package, and fix version
* **Artifact section of the DBOM page** — dependency and artifact-level risk tied to the delivery record
* **View Open Security Issues page** — live issues requiring action, prioritized by risk

From any of these views, drill into individual findings to see the affected package, version, CVE details, CVSS score, and recommended fix version. Track remediation status across environments from the centralized view.

## Remediation

When SCA vulnerabilities are detected, Delivery Shield provides:

* **Inline fix guidance** per finding — recommended upgrade version with context
* **AI-powered remediation suggestions** — alternative libraries where a fix version is unavailable
* **Automated pull requests** — apply dependency upgrades directly in the repository
* **Prioritization by exploitability** — focus on vulnerabilities that are reachable in your specific application, not just CVSS score alone


# SCA Findings

In the scan details page you can view the SCA findings associated with the selected scan.&#x20;

1. Click **View** to open the **Scan Details** page.
2. Navigate to the **SCA** tab to view the related SCA findings and details.

<figure><img src="/files/m3qVqU2ncWQl8ClzWeBd" alt=""><figcaption></figcaption></figure>

3. Click **Report** to download the findings as a report.
4. Click **Download** to export the scan details.

<figure><img src="/files/PnmpTQCgFO39iV68QQdg" alt=""><figcaption></figcaption></figure>

5. You can choose to download the **Opengrep** tool findings or **Semgrep** tool findings or **Download All** to download all the details.&#x20;

<figure><img src="/files/mlbzFvBsDUejwT4feuAg" alt=""><figcaption></figcaption></figure>


# Secrets

Secrets is designed to detect sensitive information (secrets) that may be accidentally committed into source code or embedded in build artifacts. These secrets can include exposed tokens, API keys, passwords, private keys, certificates, and other confidential data that should never be publicly accessible or stored in plain text.

It continuously scans codebases and artifacts to identify such exposures early, helping teams prevent security risks before they escalate.

## Why Are We Using This in OpsMx?

This capability is a key part of the OpsMx code security framework. In modern DevOps and GitOps workflows, developers frequently interact with multiple systems (cloud providers, CI/CD tools, databases), increasing the risk of unintentionally exposing secrets.

By integrating secret detection:

* We proactively identify leaks before they reach production
* We reduce the risk of unauthorized access and data breaches
* We enforce secure coding and compliance practices
* We minimize incident response time and remediation effort

Ultimately, it shifts security **left**—catching issues early in the development lifecycle rather than after deployment.

## Use Cases&#x20;

### **Code Scanning**

Secret detection scans source code repositories (e.g., Git-based systems) to identify hardcoded or exposed credentials.

**How it works:**

* Scans commits, pull requests, and branches in real time or periodically
* Uses pattern matching, entropy detection, and known secret signatures
* Flags secrets such as API keys, tokens, SSH keys, and passwords

**Examples:**

* A developer accidentally commits an AWS access key in a config file
* A database password is hardcoded in application code
* A private key is checked into a public repository

**Outcome:**

* Immediate alert or PR comment
* Option to block the merge (policy enforcement)
* Guidance on remediation (e.g., revoke key, rotate secret, move to vault)

### **Image Scanning**

Secrets can also be embedded in container images during the build process. This feature scans container images to detect such hidden exposures.

**How it works:**

* Analyzes image layers and filesystem contents
* Detects secrets left in environment variables, config files, or build artifacts
* Scans both base images and application layers

**Examples:**

* Credentials stored in `.env` files inside the image
* Tokens accidentally copied during Docker build steps
* Secrets cached in intermediate layers

**Outcome:**

* Alerts during CI/CD pipeline execution
* Prevents deployment of compromised images
* Helps enforce secure image-building practices


# SBOM

A Software Bill of Materials (SBOM) is a structured, machine-readable inventory of every component, open-source library, third-party dependency, and package that makes up a software application. It provides complete transparency into what your software is built from — enabling security teams to detect vulnerabilities, enforce license compliance, and respond rapidly when new threats emerge.

OpsMx Delivery Shield integrates with Syft — an easy-to-use open-source tool for generating and managing SBOMs for container images and filesystems — to gain visibility into dependencies, track OSS components, and streamline compliance and risk management.&#x20;

The platform allows users to scan code repositories, container images, and application artifacts and receive a full Software Bill of Materials (SBOM), prioritized vulnerability insights, and license risk assessments in under five minutes.

### **SBOM vs DBOM**

While an SBOM inventories what your software is made of, OpsMx goes further with the **Delivery Bill of Materials (DBOM)**:

A Software Bill of Materials (SBOM) is just a list of components that make up a software application, particularly keeping track of open-source and third-party components. However, OpsMx's Delivery Bill of Materials (DBOM) provides more granular information by capturing every step in the application's software delivery and deployment process in order to give you SDLC lifecycle visibility from code to deployment and ensure compliance. This includes results from code analysis and scanning, deployment security checks, approvals, policy enforcement, audits, and more. [OpsMX](https://www.opsmx.com/blog/how-devsecops-ci-cd-pipeline-secures-the-software-supply-chain/)

|            | SBOM                                 | DBOM                                                |
| ---------- | ------------------------------------ | --------------------------------------------------- |
| **Scope**  | What software is made of             | How software was built, tested, and deployed        |
| **Tracks** | Components, libraries, dependencies  | Code analysis, scans, approvals, policy enforcement |
| **Use**    | Vulnerability and license visibility | End-to-end SDLC compliance and audit trail          |
| **Output** | CycloneDX / SPDX / JSON              | Deployment record with full security posture        |

***

## Why Use SBOM in OpsMx

Malicious actors frequently take advantage of weaknesses found in both open-source programs and third-party software elements. Organizations that keep an SBOM will be able to swiftly detect known software vulnerabilities for timely remediation, which helps shrink their attack surface. Organizations holding an SBOM can instantly identify affected applications and start resolving them when security flaws like those in Log4j or OpenSSL emerge. Security risks increase when organizations cannot see their software dependencies clearly.

OpsMx uses SBOM generation in Delivery Shield to:

* Give engineering and security teams **complete real-time visibility** into every software component across all applications and environments
* **Automate supply chain risk detection** — identifying vulnerable or license-non-compliant dependencies before deployment
* **Feed vulnerability data** directly into the Delivery Shield Vulnerability Management and DBOM workflows
* **Enable rapid incident response** — when a zero-day is published, instantly know which applications are affected
* **Meet regulatory mandates** — including SEBI CSCRF, NIST 800-53, FedRAMP, PCI DSS, and HIPAA — with auto-generated, audit-ready SBOM exports

## How SBOM Works in OpsMx Delivery Shield

Delivery Shield generates SBOMs for build artifacts, analyzes and displays the vulnerabilities in the images getting deployed, and blocks deployments if they are likely to cause any breach to security.&#x20;

The SBOM lifecycle in Delivery Shield follows this flow:

1. **Connect** — Delivery Shield integrates with your CI/CD pipeline, container registries, and source repositories
2. **Generate** — Syft automatically generates SBOMs for container images and filesystems at the artifact level
3. **Enrich** — Each SBOM is enriched with CVE data, license information, and operational risk data from integrated vulnerability databases
4. **Monitor** — SBOMs are continuously updated as component versions change across environments
5. **Report** — Export SBOMs on demand in CycloneDX, SPDX, or JSON formats for audit and compliance use
6. **Act** — Vulnerability findings from SBOM analysis feed into the Vulnerability Management page, DBOM, and remediation workflows

## What Gets Scanned for SBOM Generation

| Source                              | Description                                                                                               |
| ----------------------------------- | --------------------------------------------------------------------------------------------------------- |
| **Container Images**                | OS packages, application libraries, and layered dependencies across all image layers                      |
| **Git Repositories**                | Open-source and third-party dependencies in source code                                                   |
| **File Systems**                    | Build artifacts and file system components                                                                |
| **Third-Party / COTS Applications** | Vendor-delivered software packages scanned for hidden components and vulnerabilities                      |
| **AI-Generated Code**               | Dependencies introduced by AI code generation tools scanned for known vulnerabilities and unsafe patterns |
| **Public Repositories**             | Any public GitHub repo or Docker Hub image scanned on demand                                              |

## Compliance Frameworks Supported

| Framework                               | Requirement Addressed                                              |
| --------------------------------------- | ------------------------------------------------------------------ |
| **SEBI CSCRF**                          | SBOM generation and maintenance for all deployed applications      |
| **NIST 800-53**                         | Software supply chain risk management and component transparency   |
| **FedRAMP**                             | Continuous monitoring and audit trail of software components       |
| **PCI DSS**                             | Third-party component visibility and vulnerability management      |
| **HIPAA**                               | Software inventory and risk management for healthcare applications |
| **US Executive Order on Cybersecurity** | Machine-readable SBOM in CycloneDX or SPDX format                  |


# Accessing SBOM Results

The SBOM results for the scans can be accessed from the project details page of each completed scan.

### To View SBOM results

1. In the Projects list page, locate your project and click the expand icon to view the project details.

<figure><img src="/files/sUATPDhmhtNFp4IbMLOg" alt=""><figcaption></figcaption></figure>

2. In the **Actions** column, click **View** to open the project. The **Project Details** page displays an overview of the project's scan history, risk posture, and component summary.

<figure><img src="/files/a6lszZc6USxcBrZrlzgL" alt=""><figcaption></figcaption></figure>

3. In the details panel, click **SBOM** to load the Software Bill of Materials for the selected scan. The SBOM view lists all detected components along with their versions, licenses, and risk indicators.

<figure><img src="/files/2DRcCCJF7Kid2g8oUxmQ" alt=""><figcaption></figcaption></figure>

3. Click the expand icon next to any component to view the **Vulnerabilities** associated with it. Each vulnerability entry displays key details such as the CVE ID, severity rating, and affected package version.
4. To analyze a specific vulnerability, click **Remediate** on the vulnerability entry. This opens the **AI Remediation Assistant**, which analyzes the vulnerability in context and provides actionable fix recommendations, including suggested version upgrades, patches, or configuration changes.

<figure><img src="/files/2OYKadC59EpnsiIHAQ5M" alt=""><figcaption></figcaption></figure>


# AI Security

AI Security addresses one of the most rapidly emerging and least understood risk categories in modern software delivery — the security of AI-driven development workflows, AI-generated code, LLM systems, and autonomous AI agents.

As organizations increasingly adopt AI tools — from code generation assistants like GitHub Copilot to autonomous agents and large language models — the attack surface expands beyond traditional software vulnerabilities into entirely new areas: model manipulation, prompt injection, data leakage, insecure agent behavior, and AI-generated code that introduces hidden security debt.

OpsMx Delivery Shield treats AI Security as a **cross-cutting layer** within the Code-to-Cloud model — augmenting traditional security controls with AI-specific safeguards that operate from development through to runtime.

{% hint style="info" %}
AI Security in OpsMx ensures that AI systems remain reliable, trustworthy, and aligned with enterprise security standards — at every stage of their lifecycle.
{% endhint %}

## Why AI Security Is Used in OpsMx

Traditional security scanners were not built for AI systems. They cannot detect prompt injection in an LLM, identify poisoned weights in a model file, or flag insecure patterns in AI-generated code that looks syntactically correct. OpsMx integrates AI Security into Delivery Shield to:

* **Close the AI security blind spot** — extending Code-to-Cloud coverage to AI-generated code, model artifacts, and LLM endpoints
* **Govern AI-assisted development** — ensuring AI tools like Copilot, Replit, and Cursor do not silently introduce vulnerabilities
* **Protect LLMs in production** — continuously testing deployed models against adversarial prompts, jailbreaks, and data leakage
* **Secure AI agent interactions** — enforcing strict boundaries on what autonomous agents can do, access, and modify
* **Meet emerging AI compliance mandates** — NIST AI RMF, EU AI Act, and organizational AI governance policies

### AI Security Capability Areas

| Capability                        | Tool                    | What It Secures                                                   |
| --------------------------------- | ----------------------- | ----------------------------------------------------------------- |
| **AI Generated Code Analysis**    | Semgrep + Trivy         | Security of code produced by AI coding assistants                 |
| **AI Model Scanning**             | ModelScan               | ML model artifact integrity, malware, and poisoned weights        |
| **LLM Adversarial Testing**       | Garak                   | Prompt injection, jailbreaks, behavioral drift in live LLMs       |
| **Secure AI Dev Environment**     | NBDefense               | Notebooks (Jupyter/VS Code) — secrets, PII, unsafe packages       |
| **Agent / MCP Security**          | Custom policies + OPA   | Autonomous agent boundaries, tool usage, context poisoning        |
| **Dynamic & Runtime AI Security** | Garak + Runtime Signals | Live AI system monitoring, anomaly detection, response validation |

### AI Generated Code Analysis

AI Generated Code Analysis validates and secures code produced by AI coding assistants — such as GitHub Copilot, Replit, Cursor, Bolt, and Lovable — before it enters the development pipeline or is committed to a repository.

AI-generated code accelerates development but often introduces hidden risks: insecure coding patterns, vulnerable third-party dependencies, hardcoded credentials, non-compliant implementations, and license violations in AI-suggested libraries.

#### **Why It Is Used in OpsMx**

A recent Stanford study showed that developers using AI coding assistants are statistically more likely to introduce insecure code if security guardrails are not enforced. OpsMx uses AI Generated Code Analysis to:

* **Scan AI-generated code for CVEs, insecure patterns, and secrets** — using the same Semgrep, SonarQube, and Trivy engines that scan human-written code
* **Evaluate third-party libraries suggested by AI** — ensuring they do not introduce known vulnerabilities or licensing risks
* **Provide immediate developer feedback** — surfacing issues at the point of code generation, not weeks later
* **Prevent AI from becoming a source of security debt** — ensuring AI acts as a productivity enhancer, not a vulnerability generator

#### **Key Capabilities in Delivery Shield**

* **SAST scanning** of AI-generated code using Semgrep and Opengrep
* **SCA scanning** of AI-suggested dependencies via Trivy and Grype
* **Secrets detection** — flags tokens, API keys, and passwords in AI-generated outputs
* **License risk visibility** — identifies unapproved or viral licenses before they block releases
* **Risk-based prioritization** — focus only on exploitable, high-impact vulnerabilities, not noise
* **Audit-ready SBOM** — instant CycloneDX/SPDX SBOM generation for AI-generated code artifacts

#### **Benefits for the User**

* Scan AI-generated code in minutes without slowing down development sprints
* Developers retain full AI productivity gains while security guardrails run silently in the background
* Security teams gain visibility into every AI-suggested dependency and its risk posture

### Agent / MCP Security

Agent / MCP Security secures how AI agents and Model Context Protocol (MCP)-based systems interact with tools, APIs, data sources, and external environments. As AI agents become increasingly autonomous — orchestrating tasks, calling APIs, modifying files, and making decisions — the security boundaries around their behavior become critical.

MCP (Model Context Protocol) enables structured communication between AI models and external tools. Without proper controls, this communication layer can be exploited through prompt injection, privilege escalation, unauthorized data access, and manipulation of execution context.

#### **Why It Is Used in OpsMx**

OpsMx uses Agent / MCP Security to:

* **Enforce strict boundaries** on what AI agents can perform — preventing unauthorized actions, privilege escalation, and data exfiltration
* **Validate tool usage** — ensuring agents only call approved tools with expected parameters
* **Protect against context poisoning** — blocking malicious instructions that attempt to redirect agent behavior
* **Maintain auditability** — logging every agent action, tool call, and decision for governance and compliance review
* **Secure multi-agent orchestration** — controlling how agents communicate with each other and with external systems

#### **Key Capabilities in Delivery Shield**

| Capability                                | Description                                                                            |
| ----------------------------------------- | -------------------------------------------------------------------------------------- |
| **Identity & Access Control**             | Assigns identities to AI agents and enforces least-privilege access to tools and data  |
| **Policy Enforcement for Tool Execution** | OPA-based policies validate every tool call before it executes                         |
| **Context Validation**                    | Detects and blocks prompt injection attempts that attempt to modify agent instructions |
| **Continuous Activity Monitoring**        | Logs all agent interactions in real time for anomaly detection and audit               |
| **Secure Communication**                  | mTLS-enforced communication between agents and external systems                        |
| **Permission Boundaries**                 | Defines hard limits on what resources agents can read, write, or modify                |

## **Benefits for the User**

* Organizations can safely leverage AI automation without losing control over what agents do
* Every agent action is logged, traceable, and auditable — meeting enterprise governance requirements
* Prompt injection and context manipulation attacks are blocked before they influence agent behavior


# AI Generated Code Analysis

AI Generated Code Analysis validates and secures code produced by AI coding assistants — such as GitHub Copilot, Replit, Cursor, Bolt, and Lovable — before it enters the development pipeline or is committed to a repository.

AI-generated code accelerates development but often introduces hidden risks: insecure coding patterns, vulnerable third-party dependencies, hardcoded credentials, non-compliant implementations, and license violations in AI-suggested libraries.

## **Why It Is Used in OpsMx**

A recent Stanford study showed that developers using AI coding assistants are statistically more likely to introduce insecure code if security guardrails are not enforced. OpsMx uses AI Generated Code Analysis to:

* **Scan AI-generated code for CVEs, insecure patterns, and secrets** — using the same Semgrep, SonarQube, and Trivy engines that scan human-written code
* **Evaluate third-party libraries suggested by AI** — ensuring they do not introduce known vulnerabilities or licensing risks
* **Provide immediate developer feedback** — surfacing issues at the point of code generation, not weeks later
* **Prevent AI from becoming a source of security debt** — ensuring AI acts as a productivity enhancer, not a vulnerability generator

## **Key Capabilities in Delivery Shield**

* **SAST scanning** of AI-generated code using Semgrep and Opengrep
* **SCA scanning** of AI-suggested dependencies via Trivy and Grype
* **Secrets detection** — flags tokens, API keys, and passwords in AI-generated outputs
* **License risk visibility** — identifies unapproved or viral licenses before they block releases
* **Risk-based prioritization** — focus only on exploitable, high-impact vulnerabilities, not noise
* **Audit-ready SBOM** — instant CycloneDX/SPDX SBOM generation for AI-generated code artifacts

## **Benefits for the User**

* Scan AI-generated code in minutes without slowing down development sprints
* Developers retain full AI productivity gains while security guardrails run silently in the background
* Security teams gain visibility into every AI-suggested dependency and its risk posture


# Agent / MCP Security

Agent / MCP Security secures how AI agents and Model Context Protocol (MCP)-based systems interact with tools, APIs, data sources, and external environments. As AI agents become increasingly autonomous — orchestrating tasks, calling APIs, modifying files, and making decisions — the security boundaries around their behavior become critical.

MCP (Model Context Protocol) enables structured communication between AI models and external tools. Without proper controls, this communication layer can be exploited through prompt injection, privilege escalation, unauthorized data access, and manipulation of execution context.

## **Why It Is Used in OpsMx**

OpsMx uses Agent / MCP Security to:

* **Enforce strict boundaries** on what AI agents can perform — preventing unauthorized actions, privilege escalation, and data exfiltration
* **Validate tool usage** — ensuring agents only call approved tools with expected parameters
* **Protect against context poisoning** — blocking malicious instructions that attempt to redirect agent behavior
* **Maintain auditability** — logging every agent action, tool call, and decision for governance and compliance review
* **Secure multi-agent orchestration** — controlling how agents communicate with each other and with external systems

## **Key Capabilities in Delivery Shield**

| Capability                                | Description                                                                            |
| ----------------------------------------- | -------------------------------------------------------------------------------------- |
| **Identity & Access Control**             | Assigns identities to AI agents and enforces least-privilege access to tools and data  |
| **Policy Enforcement for Tool Execution** | OPA-based policies validate every tool call before it executes                         |
| **Context Validation**                    | Detects and blocks prompt injection attempts that attempt to modify agent instructions |
| **Continuous Activity Monitoring**        | Logs all agent interactions in real time for anomaly detection and audit               |
| **Secure Communication**                  | mTLS-enforced communication between agents and external systems                        |
| **Permission Boundaries**                 | Defines hard limits on what resources agents can read, write, or modify                |

## **Benefits for the User**

* Organizations can safely leverage AI automation without losing control over what agents do
* Every agent action is logged, traceable, and auditable — meeting enterprise governance requirements
* Prompt injection and context manipulation attacks are blocked before they influence agent behavior


# How to do a Model Scan

The AI Model scan option is added as part of the Adhoc scan. The ability to scan AI/ML Models published on HuggingFace using NBDefence and Garak tools is added as part of this scan option.

### To Access Model Scan&#x20;

* Click on **Scan Now** button at the top right corner of the screen.

<figure><img src="/files/KEeUIuLWTexDEX2JBuGV" alt=""><figcaption></figcaption></figure>

* In the screen that appears, select **Model Scan** from the left panel.

### To Add a Project&#x20;

* To add or update a new project with model scan configurations, for scanning, click **Add Project**.&#x20;

<figure><img src="/files/6olZ56fWO3epeCrvwS5y" alt=""><figcaption></figcaption></figure>

* The **Create Project** details page is displayed as shown below. Enter the details for the following fields:

<figure><img src="/files/TdWxDv0avQUNvaAGVho5" alt=""><figcaption></figcaption></figure>

* **Name** : Enter a name for the project.&#x20;
* **Team** : Select the team for which you want to create the project.&#x20;
* **Scan Type** : The default type is Source Scan.&#x20;
* **Platform** : Select the platform type, the platform where the code resides (Github, Gitlab Server, Bitbucket, Bitbucket Server, Azure, Azure Server) for the project.
* **Account** : Choose the needed account that has been integrated for the selected platform. If no account is available for the selected platform then click **Add Account**.
  * The integration page is displayed. You can add a new account.&#x20;
* **Organization / Workspace** : Choose the organization or workspace that the selected account has access to.&#x20;
* **Scan Level** : Select the scan level; either organization level or repository level that needs to be scanned.&#x20;
* **Configuration** : Set the configuration details, and schedule the auto scan time.
  * Repo /Project : Select the repo or project name for which the scan needs to be executed.&#x20;
  * Branch :  Select the branch name for which the scan needs to be executed.&#x20;
  * Branch Pattern : Select the branch pattern for which the scan needs to be executed.&#x20;
  * Scan Upto : Select the branch limit for which the scan needs to be executed. (number of branches to be scanned)
  * Schedule Auto Scan :  Select the time range during which the scan needs to be rerun automatically.&#x20;
* Click Save.&#x20;

The project gets added for scanning.

### To Upload a Project

* To upload a project from your local, for scanning, click **Upload Project**.

<figure><img src="/files/HcMI4eAfLkeIYqbBlKVb" alt=""><figcaption></figcaption></figure>

* Click **Upload File** and select the json file that you want to add for scanning. &#x20;

<figure><img src="/files/IpQviTCNIyjgVQt5Iedm" alt=""><figcaption></figcaption></figure>

* Click **Save**.&#x20;

<figure><img src="/files/HDdpi87rWfnLEfu6M0bs" alt=""><figcaption></figcaption></figure>

The file gets added for scanning.

### To Integrate JIRA at Project Level

JIRA can be integrated at project level to create tickets whenever an alert is identified.&#x20;

* To integrate JIRA, click the Integrations icon on expanding the project.&#x20;

<figure><img src="/files/D87SrN8JKJlZ7rfSXbON" alt=""><figcaption></figcaption></figure>

* The JIRA integration page is displayed. Click **Add Account** and enter the details.&#x20;

<figure><img src="/files/zfsM6BarJXhWpjlfjjR2" alt=""><figcaption></figcaption></figure>

* Enter the values for the following fields:
  * **Account Name -** Enter the JIRA account name.&#x20;
  * **Jira Project Key -** Enter the name of your Jira project.&#x20;
  * **Jira** **URL -** Enter your Jira host Url&#x20;
  * **Jira Email Id -** Enter the username to access Jira.&#x20;
  * **Token -** Enter the password / token for the Jira account.&#x20;
  * Enable **Automatically create Jira tickets during the scan** to create JIRA ticket to the team owner when the alerts are identified.&#x20;
  * **Trigger Type** - Indicates at which level Jira tickets should be created.&#x20;
    * **Create Jira ticket at the Component Alert level** - Jira tickets will be created for each individual impacted component.&#x20;
    * **Create Jira ticket at the Deduplication Alert level** -  A single Jira ticket will be created for all the impacted components.&#x20;
    * **Creation Scope** - If Vulnerabilities is selected, Jira is created only for Critical and High alerts. If All Policies is selected Jira is created for all alerts.&#x20;
  * Enable **Assign the Jira ticket to the Team owner** if you want to assign the ticket to the team owner.&#x20;
  * **Fields -** Enter the labels that need to be added in the created Jira ticket.&#x20;
  * **Values -** Enter the values that need to be given in the Jira ticket. The given variables are replaced with actual values when the tickets are created.&#x20;
  * **Status Keyword Mapping** - You can set the keywords for the status.&#x20;
* Click **Test** to check if the entered values are valid.
* Once validated, click **Save**. The tool is connected.

### To View AI-Based Remediation Details

AI Remediation is integrated in the Scan Now option.&#x20;

1. Expand the project for which you want to view the remediation details.&#x20;
2. Click **Open Issues** to view the list of alerts.&#x20;

<figure><img src="/files/81Yfo5MHt22pqUQHq4oq" alt=""><figcaption></figcaption></figure>

3. From the alerts list, select the required alert.

<figure><img src="/files/CfxUuwD4p6lXBvtZD6Ze" alt=""><figcaption></figcaption></figure>

4. Navigate to the **Impacted Components** section and click on it.
5. In the list of applications, identify the relevant application and click **Remediate**.

<figure><img src="/files/WBeNueu8GkfIXl93QYVa" alt=""><figcaption></figcaption></figure>

The AI Remediation window is displayed. It analyzes the selected alert and provides a detailed summary of the issue, recommended remediation steps and possible workarounds.&#x20;

<figure><img src="/files/4CuuUFztzaA7F711TXEv" alt=""><figcaption></figcaption></figure>

{% hint style="info" %}
AI Remediation is supported only for repositories hosted on GitHub Cloud. Remediation is performed only when the source details of the associated artifacts or projects are available.
{% endhint %}

### To Sync Project

### To View and Interpret Scan Results&#x20;

Once the scan is complete, OpsMx generates the overall results and they are displayed as shown below: <br>

* Repos Registered
* Total Branches
* Total Scans
* Total Projects
* Auto Scan Enabled Repos

<figure><img src="/files/5iT3oTn1kbuRTpTORhYh" alt=""><figcaption></figcaption></figure>

The panel at the bottom displays the project details. On expanding each project you can view the complete details of it.

{% hint style="info" %}
The current status of the scan (completed, pending or failed) is displayed to notify the status of the project.&#x20;
{% endhint %}

* To edit the configuration details of the project, click the **Edit Configuration** button.&#x20;
* Click the **View** option in the **Action** button, to view the SAST and SCA scan results of the project.&#x20;

<figure><img src="/files/Trxwxmlwnn0xW4wx9XCO" alt=""><figcaption></figcaption></figure>

* The results page displays the complete data of the scan details.&#x20;
  * On clicking the **Download** button, the scan results are downloaded in .json or .csv format.
  * On clicking Report, the scan results are downloaded in a report format.&#x20;
  * On clicking Go to Artifact Page, you are redirected to the related artifact page.&#x20;

<figure><img src="/files/xYGeD7FNoEyXFmUtpAQW" alt=""><figcaption></figcaption></figure>


# Cloud Security

Cloud Security in OpsMx Delivery Shield protects the applications, workloads, and infrastructure deployed across cloud environments — ensuring that what was built and tested securely is also **deployed and operated securely** in AWS, Azure, and GCP.

Modern cloud environments are highly dynamic — resources are provisioned on demand, configurations change frequently, and multiple services interact across platforms and regions. This introduces a constantly shifting risk landscape where misconfigurations, over-permissioned identities, exposed services, and insecure network paths can emerge at any moment.

{% hint style="info" %}
Cloud Security in OpsMx acts as the environment-level control layer — continuously assessing cloud posture, enforcing configuration standards, and ensuring compliance as cloud environments evolve.
{% endhint %}

## Why Cloud Security Is Used in OpsMx

Cloud misconfiguration is the leading cause of cloud security breaches. Unlike application vulnerabilities that require exploitation, misconfigurations are often directly accessible — a public S3 bucket, an open security group, an IAM role with wildcard permissions. OpsMx uses Cloud Security in Delivery Shield to:

* **Continuously assess cloud posture** — not just at deployment, but as configurations drift over time
* **Surface misconfigurations before exploitation** — detecting risks like exposed storage, overly permissive IAM, and missing encryption
* **Enforce compliance standards** automatically — CIS Benchmarks, NIST 800-53, PCI DSS, and HIPAA for cloud resources
* **Provide context-aware risk assessment** — context graphs show how a misconfigured resource connects to other services, data stores, and users
* **Unify cloud risk with application risk** — CSPM findings appear alongside SAST, SCA, and DAST results in the same Delivery Shield dashboard

## Cloud Security Posture Management (CSPM)

Delivery Shield integrates **ScoutSuite** and **Cloud Custodian** to perform comprehensive CSPM across AWS, Azure, and GCP simultaneously.

| Capability                     | Description                                                      |
| ------------------------------ | ---------------------------------------------------------------- |
| **Multi-Cloud Scanning**       | Single integration covers AWS, Azure, and GCP                    |
| **Misconfiguration Detection** | IAM, storage, network, database, and logging gaps                |
| **Context Graphs**             | Visualize blast radius of each misconfigured resource            |
| **Preset Remediations**        | Pre-mapped fix steps for every CSPM alert type                   |
| **Policy-as-Code**             | Cloud Custodian rules defined in code, version-controlled in Git |
| **Continuous Monitoring**      | Recurring scheduled scans — not point-in-time audits             |
| **Exception Management**       | Time-bound exceptions tracked with expiry alerts                 |
| **Bulk Export**                | CSV and JSON export of all findings with UI filters propagated   |

**Supported Cloud Platforms:** AWS · Azure · GCP

***

## Kubernetes Security

Kubernetes Security in OpsMx Delivery Shield secures the clusters, workloads, and orchestration layer that manages containerized applications — addressing the unique and complex security challenges introduced by Kubernetes at scale.

A Kubernetes environment spans multiple components — API servers, etcd, nodes, pods, and networking layers — all of which must be secured. Misconfigurations such as overly permissive RBAC roles, exposed dashboards, insecure pod configurations, and lack of network segmentation create significant vulnerabilities that are often invisible without continuous scanning.

### **Why Kubernetes Security Is Used in OpsMx**

OpsMx uses Kubernetes Security in Delivery Shield — powered by **Kubescape** — to:

* **Scan Kubernetes manifests, Helm charts, and live clusters** for security misconfigurations and policy violations
* **Enforce CIS Benchmarks, NSA-CISA guidelines, and MITRE ATT\&CK** framework controls across all clusters
* **Block deployments to insecure clusters** via Deployment Firewall integration — Kubescape results are a direct gate on deployment
* **Monitor continuously** — detecting changes in cluster configuration in real time and evaluating each change against security policies
* **Enforce RBAC least privilege** — ensuring no service account, role, or user has more access than required

### **Key Focus Areas**

| Area                      | What Gets Secured                                     |
| ------------------------- | ----------------------------------------------------- |
| **Cluster Configuration** | Secure API access, etcd encryption, audit logging     |
| **RBAC & Identity**       | Least privilege enforcement, service account controls |
| **Workload Security**     | Secure pod configurations, no privileged containers   |
| **Network Policies**      | East-west traffic controls between services           |
| **Admission Controls**    | Policy enforcement preventing insecure deployments    |
| **Helm Chart Security**   | Scanning both templates and packaged charts           |

### **Security Frameworks Supported**

CIS Kubernetes Benchmarks · NSA-CISA Kubernetes Hardening · MITRE ATT\&CK · ARMO Best Practices · SOC 2 · NIST 800-53

### **Benefits for the User**

* Every new deployment is automatically evaluated against cluster security policies before proceeding
* Framework-aligned findings provide ready-made audit evidence for CIS and NSA compliance
* Kubescape integrates natively — no separate cluster scanner installation required


# CSPM

Cloud Security Posture Management (CSPM) continuously monitors and evaluates the security configuration of your cloud infrastructure — identifying misconfigurations, compliance violations, and exposure risks across AWS, Azure, and GCP environments before they are exploited.

OpsMx Delivery Shield integrates ScoutSuite with Cloud Custodian to perform comprehensive Cloud Security Posture Management. This enables security scanning of public cloud infrastructure, ensuring compliance and risk mitigation.&#x20;

CSPM refers to the tools and practices designed to help organizations secure their cloud environments by managing and enhancing the security posture of cloud infrastructure, services, and configurations. The goal is to identify and remediate potential security risks, misconfigurations, and vulnerabilities in cloud environments. Activities include Identity and Access Management (IAM) analysis, continuous monitoring, and compliance management.

## How CSPM Works in OpsMx Delivery Shield

ScoutSuite integration with Cloud Custodian performs comprehensive cloud security posture scans across your public cloud infrastructure. Vulnerabilities identified through CSPM policies can be added to the exception list, preventing them from generating repeated alerts. [OpsMX](https://www.opsmx.com/blog/how-devsecops-ci-cd-pipeline-secures-the-software-supply-chain/)

The CSPM workflow in Delivery Shield:

```
Cloud Account Connected (AWS / Azure / GCP)
              ↓
ScoutSuite scans cloud resources and configurations
              ↓
Cloud Custodian evaluates findings against security policies
              ↓
Results appear in the CSPM Analysis page with:
  ├── Resource-level findings by severity
  ├── Context graphs showing affected services
  ├── Preset remediations per alert type
  └── Export-ready reports (CSV / JSON)
              ↓
Alerts routed to JIRA / Slack / Email for remediation tracking
              ↓
Exceptions managed within Delivery Shield — tracked & time-bound
```

## Supported Cloud Platforms

| Cloud Provider                  | Coverage                                                                |
| ------------------------------- | ----------------------------------------------------------------------- |
| **Amazon Web Services (AWS)**   | EC2, S3, RDS, IAM, VPC, CloudTrail, Lambda, EKS, ECS, and more          |
| **Microsoft Azure**             | Storage, Virtual Machines, IAM, Network Security Groups, Key Vault, AKS |
| **Google Cloud Platform (GCP)** | Compute Engine, GCS, IAM, GKE, Cloud SQL, BigQuery                      |

## Supported Tools

| Tool                | Role                                                                                                                                               |
| ------------------- | -------------------------------------------------------------------------------------------------------------------------------------------------- |
| **ScoutSuite**      | Multi-cloud security auditing — scans cloud account configurations and generates structured findings across all major cloud providers              |
| **Cloud Custodian** | Policy-as-code enforcement engine — evaluates ScoutSuite findings against defined security policies and triggers actions (alert, block, remediate) |

## Setting Up CSPM in Delivery Shield

1. Navigate to **Setup → Integrations** in Delivery Shield
2. In the **Cloud Security** panel, select your cloud provider — **AWS**, **Azure**, or **GCP**
3. Connect the cloud account using read-access credentials (IAM role for AWS, Service Principal for Azure, Service Account for GCP)
4. Configure ScoutSuite with the connected account and set a **scan schedule** (daily, weekly, or on-demand)
5. Define Cloud Custodian **security policies** — use pre-packaged CIS/NIST rules or define custom rules
6. Enable **notifications** — route CSPM alerts to Slack, Email, or Jira
7. View results in the **CSPM Analysis page** and **Context Graph** within Delivery Shield

## Viewing CSPM Results in Delivery Shield

CSPM findings are surfaced in the following locations within Delivery Shield:

* **CSPM Analysis page** — full findings list organized by severity, resource type, cloud account, and region; filterable and exportable in CSV or JSON
* **Cloud Security section** — entry point with direct redirect to the CSPM Analysis page
* **Context Graph** — visual mapping of affected cloud resources, their connections, and impact radius
* **View Open Security Issues page** — CSPM findings listed alongside application-level vulnerabilities for unified risk view
* **Artifact pages** — CSPM findings tied to specific deployed services and artifacts


# IaC Scanning

Infrastructure as Code (IaC) has transformed how organizations define, provision, and manage cloud infrastructure — replacing manual configuration with version-controlled, repeatable code. However, misconfigurations in IaC files are now one of the leading causes of cloud security breaches. A single misconfigured Terraform file, insecure Kubernetes manifest, or misconfigured Helm chart can expose an entire production environment.

OpsMx integrates with TFSec — an open-source Infrastructure as Code security scanner — to identify misconfigurations, enforce security best practices, and reduce risks in your infrastructure deployments. This ensures your Terraform code is secure, compliant, and production-ready.

OpsMx integrates with Kubescape — an open-source Kubernetes security platform — to secure Kubernetes clusters, ensure compliance, and enable a proactive approach to DevSecOps. Security checks are integrated directly into the CI/CD pipeline to remain resilient against vulnerabilities and misconfigurations.

## Why Use IaC Security in OpsMx

Infrastructure misconfigurations are the root cause of many high-profile cloud breaches — and they are entirely preventable with early detection. Scanning IaC before deployment is dramatically cheaper and safer than discovering misconfigurations in production.

OpsMx uses IaC Security in Delivery Shield to:

* **Catch misconfigurations before they are deployed** — not after a breach has occurred
* **Enforce consistent security standards** across Terraform, Kubernetes, Helm, and Dockerfile assets regardless of team or cloud provider
* **Block insecure deployments automatically** via Deployment Firewall integration with Kubescape scan results
* **Continuously monitor live clusters** so drift from the secure baseline is detected in real time
* **Unify IaC findings** with SAST, SCA, DAST, and container scan results in a single security posture view
* **Maintain audit-ready compliance evidence** aligned with CIS, NSA, NIST, and MITRE frameworks

## How IaC Security Works in OpsMx Delivery Shield

When a pipeline is triggered or an ad hoc scan is initiated, Delivery Shield:

1. **Detects** IaC files across the target — Terraform (HCL/JSON), Kubernetes YAML, Helm charts, Dockerfiles, and CloudFormation
2. **Scans** using Trivy (TFSec engine) for Terraform and Kubescape for Kubernetes and Helm assets
3. **Evaluates** findings against built-in security framework rules and custom OPA policies
4. **Scores** misconfigurations by severity (Critical, High, Medium, Low)
5. **Reports** results in the **Deploy section of the DBOM page** and the **View Open Security Issues page**
6. **Blocks** deployments to insecure clusters based on Kubescape scan results, via the Deployment Firewall
7. **Recommends** remediation steps per finding with actionable fix guidance

## Supported IaC Scanning Tools

**Trivy — Terraform & Multi-Format IaC Scanning**

Trivy analyzes Terraform configurations — both JSON and HCL files — to detect vulnerabilities, misconfigurations, and deviations from security standards. It analyzes interdependencies between resources for end-to-end vulnerability detection in complex configurations.&#x20;

Delivery Shield also pulls IaC configuration scan results from Trivy alongside other scan results — such as container image and secret scans — and uses all of this data to calculate the overall risk of the application.&#x20;

**Kubescape — Kubernetes & Helm Security**

Kubescape is used to assess the security posture of Kubernetes clusters by identifying potential vulnerabilities and misconfigurations. It scans Kubernetes cluster configuration and resources, looking for security issues, vulnerabilities, and best practice violations.&#x20;

SSD uses Kubescape to perform security analysis on Kubernetes clusters. It runs security scans on clusters before deployment and blocks deployments in insecure clusters. The scanned results help in calculating the overall image and application risk. These results are available in the Deploy section of the DBOM page as well as in the View Open Security Issues page.&#x20;

Delivery Shield offers continuous monitoring of Kubernetes clusters by detecting changes in application deployments in real time. For each change, Delivery Shield evaluates specific security policies and can prevent actions that violate these policies. Before any deployment, Kubescape's scan results are reviewed to ensure the Kubernetes cluster is secure and compliant with industry standards like CIS benchmarks.&#x20;

## Security Frameworks & Compliance Standards Covered

| Framework                          | Tool              | Coverage                                      |
| ---------------------------------- | ----------------- | --------------------------------------------- |
| **CIS Benchmarks**                 | Kubescape + Trivy | Kubernetes, AWS, Azure, GCP hardening         |
| **AWS Well-Architected Framework** | Trivy (TFSec)     | Terraform AWS resource security               |
| **NIST 800-53**                    | Kubescape + Trivy | Infrastructure security controls              |
| **NSA-CISA Kubernetes Hardening**  | Kubescape         | Kubernetes cluster security                   |
| **MITRE ATT\&CK**                  | Kubescape         | Threat-based attack surface                   |
| **PCI DSS**                        | Kubescape + Trivy | Infrastructure compliance for payment systems |
| **SOC 2**                          | Kubescape         | Kubernetes security compliance                |

## Benefits for the User

**1. Shift Infrastructure Security Left**

Misconfigurations are caught in the pipeline — during code review, PR, or build — before they are applied to any environment. Kubescape empowers developers to fix security issues earlier in the SDLC — reducing both risks and remediation costs.&#x20;

**2. Automated, Continuous Coverage — No Manual Reviews**

Delivery Shield offers continuous monitoring of Kubernetes clusters by detecting changes in application deployments in real time. Every IaC change is scanned automatically — no manual security review required.&#x20;

**3. Pre-Deployment Blocking**

Delivery Shield runs security scans on clusters before deployment and blocks deployments in insecure clusters — ensuring no misconfigured infrastructure ever reaches production undetected.&#x20;

**4. Multi-Cloud, Multi-Format Coverage in One Tool**

A single Delivery Shield integration covers Terraform on AWS, Azure, and GCP; Kubernetes manifests; Helm charts; and Docker files — without needing separate IaC scanners per cloud or format.

**5. Framework-Aligned Compliance Evidence**

Out-of-the-box compliance checks for frameworks like CIS, NIST, and PCI DSS ensure readiness for audits. Every scan result is traceable to a specific framework control — providing ready-made audit evidence.&#x20;

**6. Custom Policies for Org-Specific Standards**

Predefined and custom policies can be tailored to address organization-specific needs. Security and platform teams define the rules once — Delivery Shield enforces them everywhere, consistently.&#x20;

**7. Unified View Alongside Application Security**

IaC scan results appear in the same dashboard as SAST, SCA, DAST, Secrets, and SBOM findings — giving security teams a complete picture of risk across both application code and infrastructure, in a single pane of glass.

## Setting Up IaC Security in Delivery Shield

**For TFSec / Trivy IaC Scanning:**

1. Navigate to **Setup → Integrations** in Delivery Shield.
2. In the **Source Scan** panel, locate **Trivy.**
3. Enable the IaC scanning toggle.
4. Connect your Terraform repository or specify the scan target path.
5. Configure severity thresholds and any custom rules.
6. IaC scans trigger automatically on pipeline events or can be run ad hoc.

**For Kubescape — Kubernetes & Helm Scanning:**

1. Navigate to **Config → Integrations** in Delivery Shield.
2. In the **Artifact** panel, click **Kubescape.**
3. Enable or disable the Helm Scan toggle as required.
4. Kubescape is integrated as part of Delivery Shield — no separate installation required
5. Results from Kubescape appear automatically in the **Deploy section of the DBOM page** and the **View Open Security Issues page.**

## Viewing IaC Scan Results in Delivery Shield

IaC scan results are available in the following locations:

* **Deploy section of the DBOM page** — Kubescape cluster and Helm scan results tied to each deployment record
* **View Open Security Issues page** — all active IaC findings requiring action, prioritized by risk severity
* **Vulnerability Management page** — consolidated view of IaC findings alongside SAST, SCA, and DAST results
* **Artifact pages** — Trivy IaC results for specific build artifacts

Each finding shows the affected resource, misconfiguration type, severity level, the violated framework rule, and actionable remediation guidance.


# How to do IAC Scan

The IAC scan option is added as part of the Adhoc scan. The ability to scan AI/ML Models published on HuggingFace using NBDefence and Garak tools is added as part of this scan option.

### To Access IAC Scan&#x20;

* Click on **Scan Now** button at the top right corner of the screen.

<figure><img src="/files/KEeUIuLWTexDEX2JBuGV" alt=""><figcaption></figcaption></figure>

* In the screen that appears, select **IAC Scan** from the left panel.

### To Add a Project&#x20;

* To add or update a new project with IAC scan configurations, for scanning, click **Add Project**.&#x20;

<figure><img src="/files/rRDbkWHvlPoYXPIMHFPG" alt=""><figcaption></figcaption></figure>

* The **Create Project** details page is displayed as shown below. Enter the details for the following fields:

<figure><img src="/files/hLhkLCjlzeem0UOqXXzC" alt=""><figcaption></figcaption></figure>

* **Name** : Enter a name for the project.&#x20;
* **Team** : Select the team for which you want to create the project.&#x20;
* **Scan Type** : The default type is IAC Scan.&#x20;
* **Platform** : Select the platform type, the platform where the code resides (Github, Gitlab Server, Bitbucket, Bitbucket Server, Azure, Azure Server) for the project.
* **Account** : Choose the needed account that has been integrated for the selected platform. If no account is available for the selected platform then click **Add Account**.
  * The integration page is displayed. You can add a new account.&#x20;
* **Organization / Workspace** : Choose the organization or workspace that the selected account has access to.&#x20;
* **Scan Level** : Select the scan level; either organization level or repository level that needs to be scanned.&#x20;
* **Configuration** : Set the configuration details, and schedule the auto scan time.
  * **Repo /Project** : Select the repo or project name for which the scan needs to be executed.&#x20;
  * **Branch** :  Select the branch name for which the scan needs to be executed.&#x20;
  * **Branch Pattern** : Select the branch pattern for which the scan needs to be executed.&#x20;
  * **Scan Upto** : Select the branch limit for which the scan needs to be executed. (number of branches to be scanned)
  * **Schedule Auto Scan** :  Select the time range during which the scan needs to be rerun automatically.&#x20;
* Click Save.&#x20;

The project gets added for scanning.

### Saving Configuration &#x20;

* After adding the configuration details you can click the **Save Configuration** option to save the adding details and trigger the scan at a later period. &#x20;

<figure><img src="/files/1moJLFD7MqMCnmRnq0Vc" alt=""><figcaption></figcaption></figure>

* The added project displays in the list with a **Paused** scan status.

<figure><img src="/files/rnMvKubS6dHkFmiMJ7LY" alt=""><figcaption></figcaption></figure>

* When you want to scan the saved project you can click the Trigger Scan option to initiate the scan.

<figure><img src="/files/E2HRL0ZURKTZz3vilGVf" alt=""><figcaption></figcaption></figure>

### To Upload a Project

* To upload a project from your local, for scanning, click **Upload Project**.

<figure><img src="/files/SUT2WW1PjqjdXvLcddEp" alt=""><figcaption></figcaption></figure>

* Click **Upload File** and select the json file that you want to add for scanning. &#x20;

<figure><img src="/files/SKTYeo18Yc04G2gMu8a7" alt=""><figcaption></figcaption></figure>

* Click **Save**.&#x20;

The file gets added for scanning.

### To View and Interpret Scan Results&#x20;

Once the scan is complete, OpsMx generates the overall results and they are displayed as shown below: <br>

* Repos Registered
* Total Branches
* Total Scans
* Total Projects
* Auto Scan Enabled Repos

<figure><img src="/files/Eat5mABHBEZt04QoJZCX" alt=""><figcaption></figcaption></figure>

The panel at the bottom displays the project details. On expanding each project you can view the complete details of it.

{% hint style="info" %}
The current status of the scan (completed, pending or failed) is displayed to notify the status of the project.&#x20;
{% endhint %}

* Click the **View** option in the **Action** button, to view the IAC scan results of the project.&#x20;

<figure><img src="/files/Trxwxmlwnn0xW4wx9XCO" alt=""><figcaption></figcaption></figure>

* The results page displays the complete data of the scan details.&#x20;
  * On clicking the **Download** button, the scan results are downloaded in .json or .csv format.
  * On clicking Report, the scan results are downloaded in a report format.&#x20;
  * On clicking **Go to Artifact Page**, you are redirected to the related artifact page.&#x20;

### Quick Actions

Each project displays 5 quick action buttons as shown:

<figure><img src="/files/TSbra4wtmFiyE096SYp3" alt=""><figcaption></figcaption></figure>

1. **Trigger Scan** – Initiates a new scan for the project or runs a scan using a previously saved configuration.
2. **Integrations** – Opens the project's **Integrations** page, where all available integrations for the project are listed.
3. **Policies** – Displays the list of policies that have been configured for the project.
4. **Edit Project** – Opens the project configuration settings, allowing you to modify the project's details and scan settings.
5. **Delete** – Removes the project from the system.


# Kubernetes Security

Kubernetes Security in OpsMx Delivery Shield secures the clusters, workloads, and orchestration layer that manages containerized applications — addressing the unique and complex security challenges introduced by Kubernetes at scale.

A Kubernetes environment spans multiple components — API servers, etcd, nodes, pods, and networking layers — all of which must be secured. Misconfigurations such as overly permissive RBAC roles, exposed dashboards, insecure pod configurations, and lack of network segmentation create significant vulnerabilities that are often invisible without continuous scanning.

## **Why Kubernetes Security Is Used in OpsMx**

OpsMx uses Kubernetes Security in Delivery Shield — powered by **Kubescape** — to:

* **Scan Kubernetes manifests, Helm charts, and live clusters** for security misconfigurations and policy violations
* **Enforce CIS Benchmarks, NSA-CISA guidelines, and MITRE ATT\&CK** framework controls across all clusters
* **Block deployments to insecure clusters** via Deployment Firewall integration — Kubescape results are a direct gate on deployment
* **Monitor continuously** — detecting changes in cluster configuration in real time and evaluating each change against security policies
* **Enforce RBAC least privilege** — ensuring no service account, role, or user has more access than required

### **Key Focus Areas**

| Area                      | What Gets Secured                                     |
| ------------------------- | ----------------------------------------------------- |
| **Cluster Configuration** | Secure API access, etcd encryption, audit logging     |
| **RBAC & Identity**       | Least privilege enforcement, service account controls |
| **Workload Security**     | Secure pod configurations, no privileged containers   |
| **Network Policies**      | East-west traffic controls between services           |
| **Admission Controls**    | Policy enforcement preventing insecure deployments    |
| **Helm Chart Security**   | Scanning both templates and packaged charts           |

## **Security Frameworks Supported**

CIS Kubernetes Benchmarks · NSA-CISA Kubernetes Hardening · MITRE ATT\&CK · ARMO Best Practices · SOC 2 · NIST 800-53

**Benefits for the User**

* Every new deployment is automatically evaluated against cluster security policies before proceeding
* Framework-aligned findings provide ready-made audit evidence for CIS and NSA compliance
* Kubescape integrates natively — no separate cluster scanner installation required


# Dynamic Testing & API Security

Dynamic Testing & API Security validates the security of **running applications** — testing how they actually behave under real-world conditions, not how their code looks at rest. It adds a critical "shift-right validation layer" that complements shift-left practices like SAST and SCA — catching vulnerabilities that only emerge when systems interact with real inputs, users, APIs, and external integrations.

Modern applications are heavily API-driven and operate in highly interconnected environments — making them particularly vulnerable to runtime exploits such as injection attacks, authentication bypasses, misconfigured endpoints, and sensitive data exposure that no amount of static analysis can predict.

{% hint style="info" %}
Dynamic Testing & API Security ensures that what was built securely also behaves securely — validating application defense under real attack conditions before customer exposure.
{% endhint %}

## DAST — Dynamic Application Security Testing

DAST tests running applications from the outside — simulating how an attacker would interact with the system. It sends crafted inputs, monitors responses, and identifies exploitable vulnerabilities including SQL injection, XSS, authentication flaws, and runtime misconfigurations.

OpsMx Delivery Shield integrates **OWASP ZAP** — enhanced with automated scanning, intercepting proxy, spidering, active/passive scanning, and fuzz testing — to provide continuous dynamic security validation against live application endpoints.

### **Why DAST Is Used in OpsMx**

SAST and SCA catch code-level and dependency risks — but many vulnerabilities only appear at runtime. DAST completes the coverage picture by:

* **Testing what attackers actually see** — live endpoints, session handling, authentication flows, and API responses
* **Triggering automatically on every deployment** — every new image deployment via Argo CD, Spinnaker, or Jenkins initiates a DAST scan through the ZAP integrator
* **Validating OWASP Top 10 coverage** — SQL injection, XSS, CSRF, broken authentication, sensitive data exposure, and more
* **Supporting API security testing** — REST, SOAP, and GraphQL endpoints scanned via imported API definitions

### **Scan Types Supported**

| Scan Type                  | Description                                                                                  |
| -------------------------- | -------------------------------------------------------------------------------------------- |
| **Passive Scan**           | Monitors traffic for security issues — safe for production, no attack payloads sent          |
| **Active Scan**            | Simulates SQL injection, XSS, command injection — for staging/pre-production                 |
| **Authenticated Scan**     | Tests internal functionality, RBAC, and user-specific vulnerabilities with valid credentials |
| **Non-Authenticated Scan** | Tests public-facing components — login pages, public APIs                                    |
| **Ad Hoc Scan**            | On-demand scan of any service URL directly from the dashboard                                |
| **Fuzz Testing**           | Tests API endpoints and form fields with varied payloads to find input validation flaws      |

### **Key Capabilities**

* **Intercepting Proxy** — analyzes and modifies requests/responses to uncover hidden vulnerabilities
* **Spidering & Crawling** — maps entire application architecture, entry points, URLs, parameters, and forms
* **Custom Scan Policies** — configure scan depth and scope per application risk profile
* **Custom Scripts** — write rules in JavaScript, Python, or Groovy for organization-specific test scenarios
* **Session Management Testing** — tracks session states, cookies, and tokens to uncover privilege escalation and logic bugs
* **Multi-URL DAST** — scan multiple service endpoints in a single scan run when authentication is shared

### **Results Location in Delivery Shield**

* **Post Deploy section of the DBOM page** — results tied to each deployment record
* **Vulnerability Management page** — findings by severity with remediation guidance
* **Top 5 Vulnerabilities tab** — immediate visibility into highest-risk runtime issues

## API Security

API Security protects the APIs that serve as the backbone of modern application communication — ensuring that service-to-service interactions, external integrations, and user-facing endpoints are secured against unauthorized access, data leakage, injection attacks, and abuse.

APIs are a major attack surface in microservices architectures. A single misconfigured or unprotected API endpoint can expose sensitive business logic, user data, or internal services.

### **Why API Security Is Used in OpsMx**

OpsMx uses API Security in Delivery Shield to:

* **Discover shadow and unmanaged APIs** — identifying endpoints that were never formally documented or secured
* **Enforce authentication and authorization** — validating OAuth, JWT, and API key controls on every endpoint
* **Detect input validation failures** — preventing injection attacks via malformed or malicious API inputs
* **Protect against data exposure** — identifying APIs that return more data than the caller is entitled to
* **Test GraphQL, REST, and SOAP APIs** — imported via OpenAPI/Swagger, WSDL, or GraphQL introspection

### **Key Aspects**

| Control                               | Description                                                       |
| ------------------------------------- | ----------------------------------------------------------------- |
| **Authentication & Authorization**    | OAuth 2.0, JWT validation, API key enforcement                    |
| **Schema Validation**                 | Prevents malformed or malicious inputs at the API boundary        |
| **Rate Limiting & Abuse Protection**  | Detects and blocks API abuse patterns                             |
| **Sensitive Data Exposure Detection** | Flags APIs returning PII, credentials, or sensitive business data |
| **API Inventory & Discovery**         | Tracks all known and shadow API endpoints across the environment  |

## Penetration Testing

Penetration Testing goes beyond automated scanning by simulating **targeted, real-world attack scenarios** to identify exploitable weaknesses in applications and systems that automated tools alone cannot surface — including business logic flaws, chained exploits, and advanced attack paths.

### **Why Penetration Testing Is Used in OpsMx**

Automated scanning answers "are there vulnerabilities?" Penetration Testing answers:

* **Can an attacker actually exploit this vulnerability?**
* **What is the potential impact of a successful attack?**
* **How far can an attacker move within the system once inside?**

OpsMx integrates penetration testing into its continuous security practices — combining automated dynamic testing with targeted deep assessments that validate whether security controls are effective in practice, not just in theory.

### **Key Capabilities**

* **Business logic flaw detection** — exploiting application workflows that automated scanners miss
* **Chained exploit identification** — finding multi-step attack paths that combine low-severity findings into critical risks
* **Credential and session abuse testing** — validating authentication strength under real attack conditions
* **Post-exploitation assessment** — determining lateral movement potential once initial access is achieved
* **Compliance validation** — meeting PCI DSS, SOC 2, and other regulatory penetration testing mandates

### **Benefits for the User**

* Validates that security controls work in practice — not just in design
* Identifies exploitable vulnerabilities missed by DAST and SAST
* Provides board-level and auditor-ready evidence of real-world security posture


# DAST

Dynamic Application Security Testing (DAST) tests your application **while it is running** — simulating real-world attacks against a live environment to uncover vulnerabilities that are invisible to static code analysis. Unlike SAST, which examines source code at rest, DAST interacts directly with a deployed application to find runtime weaknesses that only manifest under actual conditions.

DAST is a black-box security testing method that identifies vulnerabilities and security flaws in live or running applications. This technique works by simulating attacks on a live or production environment by sending malicious inputs and analyzing responses to uncover weaknesses.&#x20;

OpsMx Delivery Shield integrates with OWASP ZAP — enriching the functionality and working of ZAP. This integration offers capabilities such as automated scanning, Intercepting Proxy, Spidering and Crawling, Passive and Active scanning, and Fuzz testing to identify vulnerabilities and security gaps in a live application.&#x20;

## How DAST Works in OpsMx Delivery Shield

Delivery Shield enhances the ability to assess the security posture of applications in their operational state using ZAP, by actively testing it for vulnerabilities. Whenever a new image is deployed in an application service, the deploy event is received by SSD from any of the deploy tools such as Argo CD, Spinnaker, or Jenkins. The endpoint details are provided in the ZAP integrator, which then runs the scan to identify any vulnerabilities.&#x20;

The fetched results are available in the Post Deploy section of the DBOM page.&#x20;

The DAST scan lifecycle in Delivery Shield follows this flow:

1. **Deploy event received** — Argo CD, Spinnaker, or Jenkins notifies Delivery Shield of a new image deployment
2. **Endpoint configured** — Service URL and configuration parameters are collected from the ZAP integrator
3. **Scan initiated** — OWASP ZAP launches an automated scan against the live application endpoint
4. **Crawl & map** — ZAP spiders the application, mapping all entry points, URLs, parameters, and forms
5. **Attack & analyze** — Active scans simulate real attacks; passive scans monitor traffic for security issues
6. **Results surfaced** — Findings appear in the **Post Deploy section of the DBOM page** and the unified Delivery Shield dashboard
7. **Policy enforcement** — Results are evaluated against security policies and can block further deployments if critical issues are found

#### Supported Tool

| Tool                             | Role                                                                                                                                                                            |
| -------------------------------- | ------------------------------------------------------------------------------------------------------------------------------------------------------------------------------- |
| **OWASP ZAP (Zed Attack Proxy)** | An open-source web application security testing tool developed by OWASP, widely used for identifying vulnerabilities in web applications during development and testing phases. |

## Why Use DAST in OpsMx

SAST and SCA catch code-level and dependency risks — but many vulnerabilities only appear at runtime, in a live environment with real network traffic, session handling, and authentication flows. DAST completes the application security picture by testing the application the same way an attacker would.

Dynamic Application Security Testing is a cornerstone of modern application security. By identifying vulnerabilities in live applications, DAST helps protect against threats like SQL injection, XSS, and CSRF. Frequent scans aligned with OWASP Top 10 guidelines and integration with CI/CD pipelines ensure continuous security in fast-paced development environments.&#x20;

OpsMx uses DAST in Delivery Shield to:

* **Test what attackers actually see** — runtime behavior, session handling, live endpoints, and API responses
* **Automate post-deployment security validation** — every new deployment triggers a DAST scan automatically
* **Unify runtime findings** with SAST, SCA, Secrets, and SBOM data in a single security posture view
* **Block risky deployments** using policy enforcement when critical runtime vulnerabilities are found
* **Meet compliance requirements** — OWASP Top 10 coverage supports SOC 2, PCI DSS, NIST 800-53, and other frameworks

## Scan Types

OpsMx Delivery Shield supports all major ZAP scan modes:

**Passive Scanning**

Monitors traffic via a proxy to detect security issues like missing headers, information leakage, and outdated server technologies — without altering data. Safe to run in production as it does not actively send attack payloads.&#x20;

**Active Scanning**

In-depth scans by simulating targeted attacks — SQL Injection, XSS (Cross-Site Scripting), Command Injection — to identify severe vulnerabilities that hackers could exploit.&#x20;

**Authenticated Scans**

Authenticated scans involve logging into the application with valid credentials to test internal functionalities, including role-based access controls and user-specific vulnerabilities.&#x20;

**Non-Authenticated Scans**

Non-authenticated scans focus on the application's public-facing components, identifying vulnerabilities accessible without credentials, such as login pages or publicly available APIs.&#x20;

**Ad-Hoc Scanning**

DAST has been integrated into the Ad-hoc scanning workflow. Essential details such as the service URL and related configuration parameters are collected from the ZAP integrator, and once this information is gathered, the scan is initiated using OWASP ZAP to identify potential security vulnerabilities.&#x20;

## Key Capabilities

**Intercepting Proxy**

Acts as a "man-in-the-middle" to analyze, modify, and monitor requests and responses, uncovering hidden vulnerabilities undetected by black-box scanning alone. This gives security teams full visibility into how the application communicates and handles data in transit.&#x20;

**Spidering & Crawling**

Automatically crawls web applications — mapping the entire architecture and entry points, collecting URLs, parameters, and forms for comprehensive vulnerability detection. This ensures no endpoint or form field is missed during scanning.&#x20;

**Fuzz Testing**

Fuzz testing tests API endpoints, form fields, and query parameters with a variety of payloads to identify input validation flaws — identifying any gaps in application security.&#x20;

**Session Management Testing**

Session Management tracks session states, cookies, and tokens to test authenticated roles, privilege escalation, and logic bugs in workflows. This can help uncover anomalies, alerting teams of shortcomings in application security posture.

**Custom Scripts & Extensibility**

You can use OpsMx's integration with OWASP ZAP to write custom scripts in JavaScript, Python, or Groovy, and modular add-ons to adapt to specific testing requirements.&#x20;

**Custom Scan Policies**

The ZAP integration allows users to select a specific scan policy before triggering a DAST scan — tailoring the depth, scope, and type of tests to match the risk profile of each application or environment.&#x20;

**CI/CD Pipeline Integration**

Scans are automatically triggered during specific stages of the development lifecycle. You can integrate and automate vulnerability scans within the CI/CD pipeline using OpsMx.&#x20;

## Vulnerability Coverage — OWASP Top 10 Aligned

OWASP ZAP performs in-depth analysis to uncover vulnerabilities aligned with OWASP Top 10 guidelines.&#x20;

| Vulnerability Category                | Examples Detected                                                                                    |
| ------------------------------------- | ---------------------------------------------------------------------------------------------------- |
| **Injection Flaws**                   | SQL Injection, NoSQL Injection, OS Command Injection                                                 |
| **Broken Authentication**             | Weak credentials, missing security headers, session-related issues                                   |
| **Cross-Site Scripting (XSS)**        | Reflected, stored, and DOM-based XSS                                                                 |
| **Sensitive Data Exposure**           | Missing TLS/SSL, weak encryption, information leakage                                                |
| **Broken Access Control**             | Forced browsing, IDOR, privilege escalation                                                          |
| **Security Misconfiguration**         | Missing headers, outdated server technologies, exposed endpoints                                     |
| **Cross-Site Request Forgery (CSRF)** | Forged requests exploiting authenticated sessions                                                    |
| **API Security Issues**               | OWASP API Top 10 — broken object level authorization, excessive data exposure, API misconfigurations |

#### API Security Testing

ZAP is a powerful open-source API security testing tool. It helps identify vulnerabilities and security risks in web applications and APIs. It can detect issues such as SQL Injection, XSS, Broken Authentication, and API misconfigurations.&#x20;

ZAP supports API scanning via imported definitions:

| API Type              | Support                                                                                                                              |
| --------------------- | ------------------------------------------------------------------------------------------------------------------------------------ |
| **OpenAPI / Swagger** | Full support — import and scan all endpoints automatically                                                                           |
| **SOAP**              | Supported                                                                                                                            |
| **GraphQL**           | ZAP supports GraphQL introspection, query fuzzing, and detecting common vulnerabilities like injections and excessive data exposure. |

## To Access DAST in Delivery Shield

Navigate to Setup → Integrations. In the Post Deploy panel, click ZAP. You can use the toggle button provided below the integration tile to enable or disable it as needed.&#x20;

1. Add the service URL and authentication credentials (if running authenticated scans) in the ZAP integrator
2. Select a **Scan Policy** to define the scope and depth of the scan
3. Choose scan type — **Passive**, **Active**, **Authenticated**, or **Ad-hoc**
4. Save the configuration — DAST scans will trigger automatically on the next deployment event
5. View results in the **Post Deploy section of the DBOM page** and the **Vulnerability Management page**

## To View Results in Delivery Shield

DAST scan results are surfaced in the following locations:

* **Post Deploy section of the DBOM page** — all ZAP scan results tied to the deployment record for full traceability
* **Vulnerability Management page** — findings categorized by severity with CVE details and remediation guidance
* **Top 5 Vulnerabilities tab** — quick visibility into the most critical risks for faster prioritization and remediation
* **Security Issues: Enterprise View** — tracks overall security gaps across all applications.&#x20;


# How to do a DAST Scan

The Dynamic Application Security Testing (DAST) scan emphasis scanning of essential details such as the service URL and related configuration parameters that is collected from the ZAP integrator.&#x20;

This page explains the process of integrating ZAP with SSD and perform the  Adhoc DAST scan.&#x20;

* Before starting with the scan, you need to integrate ZAP with the OpsMx platform. Follow the steps provided in [Integrating ZAP](https://docs.opsmx.com/opsmx-delivery-shield-platform/getting-started/integrating-security-scanning-tools-in-delivery-shield/zap) to complete the process.
* If ZAP data needs to be mapped to a specific team, you need to create the team first. If no team-level segregation is required, skip this step. Follow the steps provided in [Managing Teams](https://docs.opsmx.com/opsmx-delivery-shield-platform/user-guide/manage-teams-and-access) to complete the process.&#x20;

### To Access Dast Scan

* Click on **Scan Now** button at the top right corner of the screen.

<figure><img src="https://docs.opsmx.com/~gitbook/image?url=https%3A%2F%2F2047464521-files.gitbook.io%2F%7E%2Ffiles%2Fv0%2Fb%2Fgitbook-x-prod.appspot.com%2Fo%2Fspaces%252F-MBEa1hoX6SqpDj-ymNs%252Fuploads%252FrJIKrYmqJVFzsym10w2D%252Fscan%2520now%2520.png%3Falt%3Dmedia%26token%3D56c19f36-9c4c-4212-80d3-43a1d9853d03&#x26;width=768&#x26;dpr=4&#x26;quality=100&#x26;sign=4d2e53fd&#x26;sv=2" alt=""><figcaption></figcaption></figure>

* In the screen that appears, select **Dast Scan** from the left panel.

<figure><img src="/files/GVHmVAZN2DRF0TcJG1x5" alt=""><figcaption></figcaption></figure>

Now you can **Add Project, Upload Project** or **Sync Project** to proceed with the scan.

### To Add a Project&#x20;

* To add or update a new project with artifact scan configurations, click **Add Project**.&#x20;
* The **Create Project** details page is displayed as shown below. Enter the details for the following fields:

<figure><img src="/files/MMOl59iiGlejoftNRo7k" alt=""><figcaption></figcaption></figure>

* **Name** : Enter a name for the project.&#x20;
* **Team** : Select the team for which you want to create the project.&#x20;
* **Scan Type** : The default type is Dast Scan.&#x20;
* **Platform** : Select the platform type, ZAP.
* **Scan Type** : The default scan type is Dast Scan.&#x20;
* **Account** : Choose the needed account that has been integrated for the selected platform. If no account is available for the selected platform then click **Add Account**.
  * The integration page is displayed. You can add a new account.&#x20;
* **Service URL :** Enter the URL link for which the scan needs to be done.&#x20;
* **Scan Level** : Select the scan level; either Web level or App level for which the scan needs to be applied.&#x20;
* **Schedule Scan** : You can set the scan schedule as to minutes or hours or days.
* Click Save.&#x20;

The project gets added for scanning.

### Saving Configuration &#x20;

* After adding the configuration details you can click the **Save Configuration** option to save the adding details and trigger the scan at a later period. &#x20;

<figure><img src="/files/1moJLFD7MqMCnmRnq0Vc" alt=""><figcaption></figcaption></figure>

* The added project displays in the list with a **Paused** scan status.

<figure><img src="/files/rnMvKubS6dHkFmiMJ7LY" alt=""><figcaption></figcaption></figure>

* When you want to scan the saved project you can click the Trigger Scan option to initiate the scan.

<figure><img src="/files/E2HRL0ZURKTZz3vilGVf" alt=""><figcaption></figcaption></figure>

### &#x20;To Upload a Project

1. To upload a project from your local, click **Upload Project**.

<figure><img src="/files/voCdjygwZZe2rRhJY0WB" alt=""><figcaption></figcaption></figure>

2. Click **Upload File** and select the project you want to add for scanning. &#x20;

<figure><img src="/files/t7rLh9NnvsL1pycjVtZA" alt=""><figcaption></figcaption></figure>

3. Click **Save**.&#x20;

The file gets added for scanning.&#x20;

### To Integrate JIRA at Project Level

JIRA can be integrated at project level to create tickets whenever an alert is identified.&#x20;

* To integrate JIRA, click the Integrations icon on expanding the project.&#x20;

<figure><img src="/files/D87SrN8JKJlZ7rfSXbON" alt=""><figcaption></figcaption></figure>

* The JIRA integration page is displayed. Click **Add Account** and enter the details.&#x20;

<figure><img src="/files/zfsM6BarJXhWpjlfjjR2" alt=""><figcaption></figcaption></figure>

* Enter the values for the following fields:
  * **Account Name -** Enter the JIRA account name.&#x20;
  * **Jira Project Key -** Enter the name of your Jira project.&#x20;
  * **Jira** **URL -** Enter your Jira host Url&#x20;
  * **Jira Email Id -** Enter the username to access Jira.&#x20;
  * **Token -** Enter the password / token for the Jira account.&#x20;
  * Enable **Automatically create Jira tickets during the scan** to create JIRA ticket to the team owner when the alerts are identified.&#x20;
  * **Trigger Type** - Indicates at which level Jira tickets should be created.&#x20;
    * **Create Jira ticket at the Component Alert level** - Jira tickets will be created for each individual impacted component.&#x20;
    * **Create Jira ticket at the Deduplication Alert level** -  A single Jira ticket will be created for all the impacted components.&#x20;
    * **Creation Scope** - If Vulnerabilities is selected, Jira is created only for Critical and High alerts. If All Policies is selected Jira is created for all alerts.&#x20;
  * Enable **Assign the Jira ticket to the Team owner** if you want to assign the ticket to the team owner.&#x20;
  * **Fields -** Enter the labels that need to be added in the created Jira ticket.&#x20;
  * **Values -** Enter the values that need to be given in the Jira ticket. The given variables are replaced with actual values when the tickets are created.&#x20;
  * **Status Keyword Mapping** - You can set the keywords for the status.&#x20;
* Click **Test** to check if the entered values are valid.
* Once validated, click **Save**. The tool is connected.

### To View AI-Based Remediation Details

AI Remediation is integrated in the Scan Now option.&#x20;

1. Expand the project for which you want to view the remediation details.&#x20;
2. Click **Open Issues** to view the list of alerts.&#x20;

<figure><img src="/files/81Yfo5MHt22pqUQHq4oq" alt=""><figcaption></figcaption></figure>

3. From the alerts list, select the required alert.

<figure><img src="/files/CfxUuwD4p6lXBvtZD6Ze" alt=""><figcaption></figcaption></figure>

4. Navigate to the **Impacted Components** section and click on it.
5. In the list of applications, identify the relevant application and click **Remediate**.

<figure><img src="/files/WBeNueu8GkfIXl93QYVa" alt=""><figcaption></figcaption></figure>

The AI Remediation window is displayed. It analyzes the selected alert and provides a detailed summary of the issue, recommended remediation steps and possible workarounds.&#x20;

<figure><img src="/files/4CuuUFztzaA7F711TXEv" alt=""><figcaption></figcaption></figure>

{% hint style="info" %}
AI Remediation is supported only for repositories hosted on GitHub Cloud. Remediation is performed only when the source details of the associated artifacts or projects are available.
{% endhint %}

### To Sync Project

### To View and Interpret Scan Results <a href="#to-view-and-interpret-scan-results" id="to-view-and-interpret-scan-results"></a>

Once the scan is complete, a confirmation message is updated within the project and OpsMx generates the overall results. They are displayed as shown below:

* Repos Registered
* Total Artifact Tags
* Total Scans
* Total Projects
* Auto Scan Enabled Repos

<figure><img src="/files/jUa6PK4RtiDcajcWhdNh" alt=""><figcaption></figcaption></figure>

The panel at the bottom displays the project details. On expanding each project you can view the complete details of it.

{% hint style="info" %}
The current status of the scan (completed, pending or failed) is displayed to notify the status of the project.&#x20;
{% endhint %}

* To edit the configuration details of the project, click the **Edit** button.&#x20;

<figure><img src="/files/YNpbdDykJzxm72UynK4I" alt=""><figcaption></figcaption></figure>

* Click the **View** option in the **Action** button, to view the SAST and SCA scan results of the project.&#x20;

<figure><img src="/files/1OUjvi39nvR0WeSyq76p" alt=""><figcaption></figcaption></figure>

* The results page displays the complete data of the scan details.&#x20;
  * On clicking the **Download** button, the scan results are downloaded in .json or .csv format.
  * On clicking Report, the scan results are downloaded in a report format.&#x20;
  * On clicking Go to Artifact Page, you are redirected to the related artifact page.&#x20;

<figure><img src="/files/52ClscU4mfPJ9hu4byTO" alt=""><figcaption></figcaption></figure>

### Quick Actions

Each project displays 5 quick action buttons as shown:

<figure><img src="/files/69TarDn8T8llapok7H5Y" alt=""><figcaption></figcaption></figure>

1. **Trigger Scan** – Initiates a new scan for the project or runs a scan using a previously saved configuration.
2. **Integrations** – Opens the project's **Integrations** page, where all available integrations for the project are listed.
3. **Policies** – Displays the list of policies that have been configured for the project.
4. **Edit Project** – Opens the project configuration settings, allowing you to modify the project's details and scan settings.
5. **Delete** – Removes the project from the system.


# API Security

API Security protects the APIs that serve as the backbone of modern application communication — ensuring that service-to-service interactions, external integrations, and user-facing endpoints are secured against unauthorized access, data leakage, injection attacks, and abuse.

APIs are a major attack surface in microservices architectures. A single misconfigured or unprotected API endpoint can expose sensitive business logic, user data, or internal services.

## **Why API Security Is Used in OpsMx**

OpsMx uses API Security in Delivery Shield to:

* **Discover shadow and unmanaged APIs** — identifying endpoints that were never formally documented or secured
* **Enforce authentication and authorization** — validating OAuth, JWT, and API key controls on every endpoint
* **Detect input validation failures** — preventing injection attacks via malformed or malicious API inputs
* **Protect against data exposure** — identifying APIs that return more data than the caller is entitled to
* **Test GraphQL, REST, and SOAP APIs** — imported via OpenAPI/Swagger, WSDL, or GraphQL introspection

### **Key Aspects**

| Control                               | Description                                                       |
| ------------------------------------- | ----------------------------------------------------------------- |
| **Authentication & Authorization**    | OAuth 2.0, JWT validation, API key enforcement                    |
| **Schema Validation**                 | Prevents malformed or malicious inputs at the API boundary        |
| **Rate Limiting & Abuse Protection**  | Detects and blocks API abuse patterns                             |
| **Sensitive Data Exposure Detection** | Flags APIs returning PII, credentials, or sensitive business data |
| **API Inventory & Discovery**         | Tracks all known and shadow API endpoints across the environment  |


# Penetration Testing

Penetration Testing goes beyond automated scanning by simulating **targeted, real-world attack scenarios** to identify exploitable weaknesses in applications and systems that automated tools alone cannot surface — including business logic flaws, chained exploits, and advanced attack paths.

## **Why Penetration Testing Is Used in OpsMx**

Automated scanning answers "are there vulnerabilities?" Penetration Testing answers:

* **Can an attacker actually exploit this vulnerability?**
* **What is the potential impact of a successful attack?**
* **How far can an attacker move within the system once inside?**

OpsMx integrates penetration testing into its continuous security practices — combining automated dynamic testing with targeted deep assessments that validate whether security controls are effective in practice, not just in theory.

### **Key Capabilities**

* **Business logic flaw detection** — exploiting application workflows that automated scanners miss
* **Chained exploit identification** — finding multi-step attack paths that combine low-severity findings into critical risks
* **Credential and session abuse testing** — validating authentication strength under real attack conditions
* **Post-exploitation assessment** — determining lateral movement potential once initial access is achieved
* **Compliance validation** — meeting PCI DSS, SOC 2, and other regulatory penetration testing mandates

## **Benefits for the User**

* Validates that security controls work in practice — not just in design
* Identifies exploitable vulnerabilities missed by DAST and SAST
* Provides board-level and auditor-ready evidence of real-world security posture


# Runtime Security

Runtime Security is the **last line of defense and continuous feedback loop** in OpsMx Delivery Shield's Code-to-Cloud model. While earlier stages like SAST, SCA, and DAST aim to prevent vulnerabilities from reaching production, Runtime Security operates on the assumption that some risks will inevitably pass through — and ensures they are **detected and mitigated in real time** before they cause damage.

Modern cloud-native systems are highly dynamic — with frequent deployments, auto-scaling workloads, and complex microservice interactions. This makes it impossible to rely solely on pre-deployment controls. Runtime Security fills this gap by continuously monitoring system behavior, detecting deviations from established baselines, and feeding insights back into earlier pipeline stages to prevent recurrence.

{% hint style="info" %}
Runtime Security in OpsMx is not passive monitoring — it is active, continuous, and connected. Findings from runtime feed directly back into code, build, and deployment controls — creating a true closed-loop security posture.
{% endhint %}

## Why Runtime Security Is Used in OpsMx

OpsMx uses Runtime Security in Delivery Shield to:

* **Detect threats that pre-deployment scanning cannot catch** — insider threats, zero-days, and runtime exploits that circumvent earlier controls
* **Continuously validate production workloads** — ensuring the security posture of running systems does not degrade between deployments
* **Create a feedback loop** — runtime anomalies inform and strengthen earlier-stage controls (code, build, deployment)
* **Enable faster incident response** — real-time detection reduces mean time to detect (MTTD) and mean time to respond (MTTR)
* **Protect AI systems in production** — extending runtime security to LLMs, agents, and AI-driven workloads


# Runtime Signals

Runtime Signals are the real-time data inputs that power effective runtime security in Delivery Shield — representing continuously collected data from applications, containers, infrastructure, and user interactions. These signals provide visibility into how systems actually behave under operating conditions, enabling the detection of anomalies that indicate potential threats.

Runtime Signals include process activity, network traffic patterns, API call volumes, system logs, access patterns, file system events, and resource consumption metrics.

## **How Runtime Signals Work in OpsMx**

Delivery Shield correlates signals across multiple sources to establish a **behavioral baseline** for each workload, service, and environment. Deviations from this baseline are flagged as potential risks.

| Signal Type          | Examples                                             | What It Detects                           |
| -------------------- | ---------------------------------------------------- | ----------------------------------------- |
| **Process Activity** | Unexpected process execution inside containers       | Container breakout, malware execution     |
| **Network Traffic**  | Unusual outbound connections, port scanning          | Data exfiltration, C2 communication       |
| **API Calls**        | Abnormal call volumes, unexpected endpoints accessed | API abuse, unauthorized access            |
| **System Logs**      | Authentication failures, privilege use               | Credential attacks, insider threats       |
| **Resource Usage**   | CPU/memory spikes, storage anomalies                 | Cryptomining, resource abuse              |
| **Access Patterns**  | Unusual user or service account behavior             | Compromised credentials, lateral movement |

### **Key Characteristics**

* **Contextual** — tied to specific workloads, services, or users for precise attribution
* **Continuous** — collected in real time across all connected environments
* **Correlated** — combined across multiple signal sources for deeper, more accurate insights
* **Actionable** — linked directly to remediation workflows, not just alert dashboards

## **Benefits for the User**

* Security teams gain real-time visibility into production behavior without requiring agents or code instrumentation changes
* Signals feed directly into analytics and trend analysis — enabling proactive risk identification before incidents occur
* Runtime findings are linked back to code versions and deployment records for root-cause tracing


# Drift / Anomalies

Drift & Anomaly Detection identifies **deviations from the expected or approved state** of systems, workloads, and configurations in production. In dynamic cloud environments, changes happen continuously — some intentional (deployments, scaling, configuration updates) and others unauthorized or malicious.

Drift and anomaly detection ensures that **what was tested and approved is what actually runs in production** — and that any deviation, however subtle, is caught and investigated.

## **Two Types of Deviations Detected**

**Configuration Drift** — when the actual state of a system diverges from its intended baseline:

| Example                                                         | Risk                        |
| --------------------------------------------------------------- | --------------------------- |
| Unauthorized changes to Kubernetes RBAC configurations          | Privilege escalation        |
| Modified security group rules in cloud infrastructure           | Unexpected network exposure |
| Changes to container images or runtime parameters post-approval | Supply chain compromise     |
| Altered security policies or admission control rules            | Policy bypass               |

**Behavioral Anomalies** — unusual patterns in system activity:

| Example                                         | Risk                          |
| ----------------------------------------------- | ----------------------------- |
| Unexpected process execution within a container | Malware or exploit running    |
| Abnormal API usage patterns                     | Account takeover or API abuse |
| Sudden spikes in resource consumption           | Cryptomining or DDoS          |
| Unusual outbound network traffic                | Data exfiltration             |

## **Why Drift & Anomaly Detection Is Used in OpsMx**

Many sophisticated attacks do not rely on introducing new vulnerabilities — they exploit **changes or inconsistencies in the environment**. Drift detection closes this vector by:

* **Continuously comparing running state against approved baseline** — any deviation triggers an alert
* **Creating a continuous validation loop** — ensuring approved configurations persist across deployments and scaling events
* **Detecting silent failures and insider threats** — changes that should not have happened are immediately visible
* **Improving compliance posture** — continuous drift detection provides always-current evidence that systems match their approved configurations
* **Reducing time to detect** — anomalies are surfaced in real time, not discovered during periodic audits

## **Benefits for the User**

* Organizations know immediately when production deviates from what was approved — no more waiting for quarterly audits to surface drift
* Behavioral anomalies are detected before they escalate into incidents
* Continuous drift evidence supports regulatory frameworks requiring ongoing compliance validation (SOC 2, PCI DSS, HIPAA)


# Container & Artifact Security

Container & Artifact Security secures the software components — container images, binaries, packages, libraries, and build outputs — that are built, stored, and deployed across the delivery pipeline. In modern DevOps environments, these components form the backbone of the software supply chain. Any vulnerability, misconfiguration, or malicious code embedded here can propagate across every environment the artifact is deployed to — at scale and without warning.

Unlike traditional application models, containerized workloads are **built once and deployed many times**. A vulnerability in a base image or a compromised dependency can replicate silently across development, staging, and production — making it critical to validate every component at the source, before it ever enters the pipeline.

{% hint style="info" %}
Container & Artifact Security in OpsMx acts as the build-time and supply chain control point — ensuring that what gets deployed is not only functional but secure, trusted, and compliant.
{% endhint %}

## Why Container & Artifact Security Is Used in OpsMx

OpsMx uses Container & Artifact Security in Delivery Shield to:

* **Validate every image and artifact before deployment** — blocking vulnerable or untrusted components from advancing through the pipeline
* **Protect the software supply chain** — detecting compromised dependencies, tampered artifacts, and hidden malicious code
* **Generate SBOMs for every artifact** — providing complete component transparency in CycloneDX and SPDX formats
* **Enforce deployment gates** — Trivy and Grype scan results feed directly into the Deployment Firewall for automated block/allow decisions
* **Continuously monitor deployed images** — not just at build time, but in running environments as new CVEs are published.&#x20;


# Image Scanning

## Image Scanning

Container Image Scanning identifies vulnerabilities and security risks within container images **before they are deployed** to any environment. Container images commonly include operating system packages, third-party libraries, application code, and configuration — any one of which can harbor CVEs, misconfigurations, or embedded secrets.

OpsMx Delivery Shield integrates **Trivy** and **Grype** to scan every layer of every container image — providing comprehensive visibility into what is running inside each deployable unit.

## **Key Capabilities**

| Capability                        | Description                                                                                                                                |
| --------------------------------- | ------------------------------------------------------------------------------------------------------------------------------------------ |
| **CVE Detection**                 | Known vulnerabilities in OS packages and application dependencies — matched against NVD, GitHub Advisories, and Linux Distribution notices |
| **Layer-by-Layer Scanning**       | Scans every layer of a container image — including base OS, installed packages, and application code                                       |
| **Secrets Detection**             | Identifies API keys, tokens, and passwords accidentally embedded in image layers                                                           |
| **Misconfiguration Detection**    | Flags images running as root, with excessive privileges, or with exposed ports                                                             |
| **SBOM Generation**               | Automatically generates a full SBOM per image in CycloneDX or SPDX format                                                                  |
| **Periodic Deployed Image Scans** | Trivy triggers recurring scans on already-deployed images as new CVEs are published — not just at build time                               |
| **Policy-Based Gating**           | High-severity findings automatically block image promotion via the Deployment Firewall                                                     |

## **Supported Registries**

Docker Hub · Amazon ECR · Google Container Registry · Google Artifact Registry · Azure Container Registry · JFrog Artifactory · GitLab Container Registry · Quay

## **Benefits for the User**

* Vulnerabilities are caught at the image layer — before they are deployed to any environment
* Continuously updated CVE data ensures newly published vulnerabilities surface on running workloads, not just at next build
* SBOM per image supports SEBI CSCRF, NIST 800-53, and supply chain compliance requirements automatically


# Artifact Scanning

## Artifact Scanning

Artifact Scanning extends security validation beyond container images to all other components in the software supply chain — **binaries, packages, libraries, build outputs, and third-party dependencies** — ensuring the entire delivery chain is trusted, not just the final image.

Modern applications depend heavily on open-source and third-party components. Any one of these can introduce known CVEs, license violations, tampered artifacts, or hidden malicious code — risks that container image scanning alone does not fully cover.

## **Why Artifact Scanning Is Used in OpsMx**

OpsMx uses Artifact Scanning in Delivery Shield to:

* **Validate all build outputs and dependencies** before they are consumed or promoted to the next pipeline stage
* **Maintain a trusted artifact repository** — enforcing strict controls on which artifacts are allowed into the build and deployment process
* **Detect tampered or untrusted artifacts** — verifying artifact integrity against expected checksums and signatures
* **Provide end-to-end supply chain visibility** — every component from code to packaged artifact is accounted for and assessed

## **Key Capabilities**

| Capability                            | Description                                                                     |
| ------------------------------------- | ------------------------------------------------------------------------------- |
| **Dependency Vulnerability Scanning** | CVE detection across all third-party libraries and packages                     |
| **License Compliance**                | Flags license types that violate organizational policy (GPL, AGPL, etc.)        |
| **Artifact Integrity Verification**   | Validates artifact checksums and code signing against approved baselines        |
| **SBOM Generation**                   | Full SBOM per artifact in CycloneDX or SPDX format                              |
| **JFrog Xray Integration**            | Deep recursive scanning of artifacts in JFrog Artifactory repositories          |
| **Hidden Malicious Code Detection**   | Identifies supply chain attacks where legitimate packages have been compromised |

## **Results in Delivery Shield**

* **Artifact section of the DBOM page** — artifact findings tied to each deployment record
* **Vulnerability Management page** — consolidated findings across all artifact types
* **View Open Security Issues page** — active issues prioritized by severity for immediate action


# Artifact Security

## Artifact Security

Artifact Security is a detailed insight into all the artifacts, their vulnerabilities, security issues and risk status before and after deployment. When a new image is detected during any build or deployment stage, it is analyzed and the scan results are displayed.&#x20;

### To Access Artifact Security&#x20;

* Navigate to the Artifact Security tab and click on it.&#x20;

The Artifact Security page displays the risk status for the different artifacts:

* Deployed Artifacts
* Generated Artifacts
* Plugin Artifacts


# Deployed Artifacts

The Deployed Artifacts page displays the artifact status of all the generated and deployed artifacts in the application.&#x20;

* The panel at the top displays the total number of artifacts in the application, the number of deployed artifacts and number of deployed overridden artifacts.
* The **Artifact Risk Status** panel displays the summary of the risk status of the listed artifacts
  * **Critical Risk** - The deployments that are of critical risk.&#x20;
  * **High Risk** - The deployments that are of high risk.&#x20;
  * **Medium Risk** - The deployments that are of medium risk.&#x20;
  * **Low Risk** - The deployments that are of low risk.

<figure><img src="/files/U0DmWrxqBt4zaHF0RfAF" alt=""><figcaption></figcaption></figure>

The panel below displays the details of the artifacts.

<figure><img src="/files/OQfkDaYp2K8SgA90dCC4" alt=""><figcaption></figcaption></figure>

* **Application -** Displays the name of the application.&#x20;
* **Account** - Displays the associated account name of the application.&#x20;
* **Artifact SHA** - Displays the specific version of the artifact.&#x20;
* **Artifact Version** - Displays the version of the artifact.&#x20;
* **Artifact Tags** - Displays the tags for the artifact that were sent in the build events.&#x20;
* **Risk Status** - Displays the risk status of the artifact.&#x20;
* **Stage** - Displays the life stage of the artifact.&#x20;
* **Vulnerability** - Displays the number of vulnerabilities identified for the given artifact. On clicking it, the [Vulnerabilities Management](https://docs.opsmx.com/opsmx-delivery-shield-platform/user-guide/vulnerability-management) details page is displayed.&#x20;
* **Open Issues** - Displays the number of open security issues (alerts) identified for the given artifact.&#x20;
* **Created on** - Displays the date when the artifact was created.&#x20;
* **Built by** - Displays the build details of the artifact.&#x20;
* **Source Repository** - Displays the source repository name of the artifact.&#x20;
* **Cluster** - Displays the name of the cluster to which the artifact belongs to.&#x20;
* **OSS Risk** - On clicking View, the OSS risk page for the related artifact is displayed.&#x20;
* **SBOM** - On clicking View, the SBOM page for the related artifact is displayed.&#x20;
* **DBOM** - On clicking the displayed risk status, the DBOM page for the related artifact is displayed.&#x20;
* **Actions** - On clicking the three dots, you can view the list of scans run on the artifact as shown below:

You can download the scan results by clicking on it.&#x20;

### View SBOM for Artifacts

The SBOM for all the deployed artifacts can be viewed by clicking the **View SBOM** option as shown below:&#x20;

<figure><img src="/files/KpxID71Fpn1gQkwbQWrg" alt=""><figcaption></figcaption></figure>

On clicking **View SBOM**, the SBOM page is displayed.&#x20;

<figure><img src="/files/I1SMTpQsMC3xWpAax8Ot" alt=""><figcaption></figcaption></figure>

It displays the various components and related details of the components as shown below:

* **Component** - Displays the components of the artifact.
* **Version** - Displays the components version.&#x20;
* **Package URL** - Displays the package URL of the component.
* **License** - Displays the list of licenses that are available for the component.&#x20;
* **Vulnerabilities** - Displays the count of vulnerabilities related to the component.&#x20;
* **EOL Risk** - Displays the score of how close the OSS packages used in their project are towards End-of-Life (EOL).
* **Dependency** -&#x20;
* **OSS Risk** - By clicking **View**, you can view the artifact details of the component.&#x20;
* **Actions** - By clicking **Edit License**, you can edit the license type.

{% hint style="info" %}

* You can view the vulnerabilities of the components by clicking the **Vulnerabilities** column.&#x20;
  {% endhint %}

- You can download the SBOM details in .pdf, .json or .csv format by clicking the **Download** button.&#x20;
- You can download the SBOM details in report format by clicking the **Report** button. The downloaded report will be a consolidated pictorial form as shown below:

<figure><img src="/files/rxerGqnn6Smbfz1NjNcc" alt=""><figcaption></figcaption></figure>

### To View SBOM Report for Individual Artifacts

The SBOM for the individual artifacts can also be viewed. Navigate to the SBOM column and click **View**.&#x20;

<figure><img src="/files/wp8Gyz5tsylATyNjrGOb" alt=""><figcaption></figcaption></figure>

The SBOM page for the selected artifact is displayed as shown below:

<figure><img src="/files/RBg0khCNVpW6frojIMJN" alt=""><figcaption></figcaption></figure>

### To Download SBOM details as Report&#x20;

The SBOM details can be downloaded in a representation format.

* Navigate to the top right corner of the page and click **Report**.&#x20;

<figure><img src="/files/ilznWoupx8lL9UZu3l8i" alt=""><figcaption></figcaption></figure>

* The page details are consolidated as a report and downloaded in the PDF format as shown below:

<figure><img src="/files/fgGmB94WKK0BikYFRB7B" alt=""><figcaption></figcaption></figure>

### To Download SBOM details&#x20;

The SBOM details can be downloaded in .Json or .CSV file or .pdf format by clicking the **Download** button.&#x20;

* Navigate to the top right corner of the page and click **Download**.&#x20;

<figure><img src="/files/kmB35IXW1gzEQfxC8G0Y" alt=""><figcaption></figcaption></figure>

The SBOM details are downloaded in the selected format.&#x20;

### To View Licenses of the Components

The license details of all the components that are available for the given application can be downloaded. &#x20;

* Navigate to the top right corner of the page and click **Licenses**.&#x20;

<figure><img src="/files/2LHQrpTK5jWKyTWdHFM7" alt=""><figcaption></figcaption></figure>

* The license details are consolidated as a report and downloaded in .txt or .html or .md format.&#x20;

{% hint style="info" %}
You can view the vulnerabilities of the components by clicking the **Vulnerabilities** column.&#x20;
{% endhint %}


# Generated Artifacts

The Generated Artifacts page displays the artifact status of all the generated but not deployed artifacts in the application.&#x20;

* The panel at the top displays the total number of artifacts in the application, the number of deployed artifacts and number of deployed overridden artifacts.
* The **Artifact Risk Status** panel displays the summary of the risk status of the listed artifacts
  * **Critical Risk** - The deployments that are of critical risk.&#x20;
  * **High Risk** - The deployments that are of high risk.&#x20;
  * **Medium Risk** - The deployments that are of medium risk.&#x20;
  * **Low Risk** - The deployments that are of low risk.

<figure><img src="/files/U0DmWrxqBt4zaHF0RfAF" alt=""><figcaption></figcaption></figure>

The panel below displays the details of the artifacts.

<figure><img src="/files/OQfkDaYp2K8SgA90dCC4" alt=""><figcaption></figcaption></figure>

* **Application -** Displays the name of the application.&#x20;
* **Account** - Displays the associated account name of the application.&#x20;
* **Artifact SHA** - Displays the specific version of the artifact.&#x20;
* **Artifact Version** - Displays the version of the artifact.&#x20;
* **Artifact Tags** - Displays the tags for the artifact that were sent in the build events.&#x20;
* **Risk Status** - Displays the risk status of the artifact.&#x20;
* **Stage** - Displays the life stage of the artifact.&#x20;
* **Vulnerability** - Displays the number of vulnerabilities identified for the given artifact. On clicking it, the [Vulnerabilities Management](https://docs.opsmx.com/opsmx-delivery-shield-platform/user-guide/vulnerability-management) details page is displayed.&#x20;
* **Open Issues** - Displays the number of open security issues (alerts) identified for the given artifact.&#x20;
* **Created on** - Displays the date when the artifact was created.&#x20;
* **Built by** - Displays the build details of the artifact.&#x20;
* **Source Repository** - Displays the source repository name of the artifact.&#x20;
* **Cluster** - Displays the name of the cluster to which the artifact belongs to.&#x20;
* **OSS Risk** - On clicking View, the OSS risk page for the related artifact is displayed.&#x20;
* **SBOM** - On clicking View, the SBOM page for the related artifact is displayed.&#x20;
* **DBOM** - On clicking the displayed risk status, the DBOM page for the related artifact is displayed.&#x20;
* **Actions** - On clicking the three dots, you can view the list of scans run on the artifact as shown below:

You can download the scan results by clicking on it.&#x20;

### View SBOM for Artifacts

The SBOM for all the deployed artifacts can be viewed by clicking the **View SBOM** option as shown below:&#x20;

<figure><img src="/files/Vz49u55EhvWaF6cI4f6H" alt=""><figcaption></figcaption></figure>

On clicking **View SBOM**, the SBOM page is displayed.&#x20;

<figure><img src="/files/sJuUrwnOzEmV9KendWPe" alt=""><figcaption></figcaption></figure>

It displays the various components and related details of the components as shown below:

* **Component** - Displays the components of the artifact.
* **Version** - Displays the components version.&#x20;
* **Package URL** - Displays the package URL of the component.
* **License** - Displays the list of licenses that are available for the component.&#x20;
* **Vulnerabilities** - Displays the count of vulnerabilities related to the component.&#x20;
* **EOL Risk** - Displays the score of how close the OSS packages used in their project are towards End-of-Life (EOL).
* **Dependency** -&#x20;
* **OSS Risk** - By clicking **View**, you can view the artifact details of the component.&#x20;
* **Actions** - By clicking **Edit License**, you can edit the license type.

{% hint style="info" %}

* You can view the vulnerabilities of the components by clicking the **Vulnerabilities** column.&#x20;
  {% endhint %}

- You can download the SBOM details in .pdf, .json or .csv format by clicking the **Download** button.&#x20;
- You can download the SBOM details in report format by clicking the **Report** button. The downloaded report will be a consolidated pictorial form as shown below:

<figure><img src="/files/rxerGqnn6Smbfz1NjNcc" alt=""><figcaption></figcaption></figure>

### To View SBOM Report for Individual Artifacts

The SBOM for the individual artifacts can also be viewed. Navigate to the SBOM column and click **View**.&#x20;

<figure><img src="/files/fLZlS6yl4oDefe48XUCs" alt=""><figcaption></figcaption></figure>

The SBOM page for the selected artifact is displayed as shown below:

<figure><img src="/files/RBg0khCNVpW6frojIMJN" alt=""><figcaption></figcaption></figure>

### To Download SBOM details as Report&#x20;

The SBOM details can be downloaded in a representation format.

* Navigate to the top right corner of the page and click **Report**.&#x20;

<figure><img src="/files/PU1am2PCnNWLD4A3BtH9" alt=""><figcaption></figcaption></figure>

* The page details are consolidated as a report and downloaded in the PDF format as shown below:

<figure><img src="/files/fgGmB94WKK0BikYFRB7B" alt=""><figcaption></figcaption></figure>

### To Download SBOM details&#x20;

The SBOM details can be downloaded in .Json or .CSV file or .pdf format by clicking the **Download** button.&#x20;

* Navigate to the top right corner of the page and click **Download**.&#x20;

<figure><img src="/files/f886wRTuYC5ZrJ7UJLu9" alt=""><figcaption></figcaption></figure>

The SBOM details are downloaded in the selected format.&#x20;

### To View Licenses of the Components

The license details of all the components that are available for the given application can be downloaded. &#x20;

* Navigate to the top right corner of the page and click **Licenses**.&#x20;

<figure><img src="/files/qiljrAKvQweHDYphdXWT" alt=""><figcaption></figcaption></figure>

* The license details are consolidated as a report and downloaded in .txt or .html or .md format.&#x20;

{% hint style="info" %}

* You can view the vulnerabilities of the components by clicking the **Vulnerabilities** column.&#x20;
  {% endhint %}


# Plugin Artifacts

The Plugin Artifacts page displays the artifact status of all the plugins available in the application.&#x20;

* The panel at the top displays the total number of plugin artifacts in the application, and the risk status of the plugins.&#x20;
* The following risk status are displayed:
  * **Critical Risk** - The plugins that are of critical risk.&#x20;
  * **High Risk** - The plugins that are of high risk.&#x20;
  * **Medium Risk** - The plugins that are of medium risk.&#x20;
  * **Low Risk** - The plugins that are of low risk.

<figure><img src="/files/Ib0LGlGpQSVD97snMUBt" alt=""><figcaption></figcaption></figure>

The panel below displays the details of the plugins:

<figure><img src="/files/72Dqe1NhOTTWKYplZXbU" alt=""><figcaption></figcaption></figure>

* **Plugin** - Displays the name of the plugin.&#x20;
* **Plugin Version** - Displays the version of the plugin&#x20;
* **Risk Status** - Displays the risk status of the plugin.&#x20;
* **Vulnerability** - Displays the number of vulnerabilities identified for the given plugin. On clicking it, the [Vulnerabilities Management](https://docs.opsmx.com/opsmx-delivery-shield-platform/user-guide/vulnerability-management) details page is displayed.&#x20;
* **Security Issues** - Displays the number of open security issues (alerts) identified for the given plugin.&#x20;
* **Created on** - Displays the date when the plugin was created.
* **SBOM** - On clicking View, the SBOM page for the related plugin is displayed.&#x20;
* **DBOM** - On clicking View, the DBOM page for the related plugin is displayed.&#x20;
* **View Reports** - On clicking the three dots, you can view the list of scans run on the plugin as shown below:

<figure><img src="/files/TqCf3lAQPpXgb4go1fe2" alt=""><figcaption></figcaption></figure>

You can download the scan results by clicking on it.&#x20;

### View SBOM

The SBOM for the artifacts can be viewed by clicking the **View SBOM** option displayed in the page.&#x20;

<figure><img src="/files/0NF5pDl8YfOlaMEwB29a" alt=""><figcaption></figcaption></figure>

On clicking **View SBOM**, the SBOM page is displayed.&#x20;

<figure><img src="/files/sttF1HwqVWGlz7PUJk6L" alt=""><figcaption></figcaption></figure>

It displays the various components and related details of the components as shown below:

* **Component** - Displays the components of the artifact.
* **Version** - Displays the components version.&#x20;
* **Package URL** - Displays the package URL of the component.
* **License** - Displays the list of licenses that are available for the component.&#x20;
* **Vulnerabilities** - Displays the count of vulnerabilities related to the component.&#x20;
* **EOL Risk** - Displays the score of how close the OSS packages used in their project are towards End-of-Life (EOL).
* **Dependency** -&#x20;
* **OSS Risk** - By clicking **View**, you can view the artifact details of the component.&#x20;
* **Actions** - By clicking **Edit License**, you can edit the license type.

{% hint style="info" %}

* You can view the vulnerabilities of the components by clicking the **Vulnerabilities** column.&#x20;
  {% endhint %}

### View Report&#x20;

The SBOM details can be downloaded in PDF format.

* Navigate to the top right corner and click **Report**.&#x20;

<figure><img src="/files/9b5WyYTpk9uCaLbbBPja" alt=""><figcaption></figcaption></figure>

* The page details is consolidated as a report and downloaded in PDF format as shown below:

<figure><img src="/files/fgGmB94WKK0BikYFRB7B" alt=""><figcaption></figcaption></figure>

{% hint style="info" %}
You can also download the SBOM details in Json or .CSV file format by clicking the **Download** button.&#x20;
{% endhint %}


# Mobile Artifacts

The Mobile Artifacts page displays the artifact status of all the mobile application artifacts stored in the repositories.&#x20;

* The panel at the top displays the total number of mobile artifacts in the repositories, and the risk status of them.&#x20;
* The following risk status are displayed:
  * **Critical Risk** - The artifacts that are of critical risk.&#x20;
  * **High Risk** - The artifacts  that are of high risk.&#x20;
  * **Medium Risk** - The artifacts  that are of medium risk.&#x20;
  * **Low Risk** - The artifacts  that are of low risk.

<figure><img src="/files/xkfRP5EOfA5IVmwdbIVi" alt=""><figcaption></figcaption></figure>

The panel below displays the details of the artifacts:

<figure><img src="/files/fSKVZGvAeoAzHl8MBaFT" alt=""><figcaption></figcaption></figure>

* **Artifact** - Displays the name of the artifact.&#x20;
* **Artifact Version** - Displays the artifact version of the artifact.
* **Semantic Tags** - Displays the semantic tags of the repositories.&#x20;
* **Vulnerability** - Displays the number of vulnerabilities identified for the given artifact. On clicking it, the [Vulnerabilities Management](https://docs.opsmx.com/opsmx-delivery-shield-platform/user-guide/vulnerability-management) details page is displayed.&#x20;
* **Security Issues** - Displays the number of open security issues (alerts) identified for the given artifact.&#x20;
* **Created on** - Displays the date when the artifact was created.
* **SBOM** - On clicking View, the SBOM page for the related artifact is displayed.&#x20;
* **DBOM** - On clicking View, the DBOM page for the related artifact is displayed.&#x20;
* **View Reports** - On clicking the three dots, you can view the list of scans run on the artifact as shown below:

<figure><img src="/files/TqCf3lAQPpXgb4go1fe2" alt=""><figcaption></figcaption></figure>

You can download the scan results by clicking on it.&#x20;

### View SBOM

The SBOM for the artifacts can be viewed by clicking the **View SBOM** option displayed in the page.&#x20;

<figure><img src="/files/kCLDGEACHNP6UekpmIu4" alt=""><figcaption></figcaption></figure>

On clicking **View SBOM**, the SBOM page is displayed.&#x20;

<figure><img src="/files/RypMtyyIQR0esrirDAFT" alt=""><figcaption></figcaption></figure>

It displays the various components and related details of the components as shown below:

* **Component** - Displays the components of the artifact.
* **Version** - Displays the components version.&#x20;
* **Package URL** - Displays the package URL of the component.
* **License** - Displays the list of licenses that are available for the component.&#x20;
* **Vulnerabilities** - Displays the count of vulnerabilities related to the component.&#x20;
* **EOL Risk** - Displays the score of how close the OSS packages used in their project are towards End-of-Life (EOL).
* **Dependency** -&#x20;
* **OSS Risk** - By clicking **View**, you can view the artifact details of the component.&#x20;
* **Actions** - By clicking **Edit License**, you can edit the license type.

{% hint style="info" %}

* You can view the vulnerabilities of the components by clicking the **Vulnerabilities** column.&#x20;
  {% endhint %}

### View Report&#x20;

The SBOM details can be downloaded in PDF format.

* Navigate to the top right corner and click **Report**.&#x20;

<figure><img src="/files/Ri07eic5coDDLjxKXZkA" alt=""><figcaption></figcaption></figure>

* The page details is consolidated as a report and downloaded in PDF format as shown below:

<figure><img src="/files/fgGmB94WKK0BikYFRB7B" alt=""><figcaption></figcaption></figure>

{% hint style="info" %}
You can also download the SBOM details in Json or .CSV file format by clicking the **Download** button.&#x20;
{% endhint %}


# AMI Scan Artifacts

The AMI Scan Artifacts page allows users to scan Amazon Machine Images (AMIs) stored in Amazon S3 buckets and generate a Software Bill of Materials (SBOM) for managed AWS EC2 instances.

The panel at the top displays the total number of artifacts in the application, the number of deployed artifacts and number of deployed overridden artifacts.

The top panel displays the summary of the risk status of the listed artifacts

* Critical Risk - The deployments that are of critical risk.
* High Risk - The deployments that are of high risk.
* Medium Risk - The deployments that are of medium risk.
* Low Risk - The deployments that are of low risk.

<img src="/files/3LNx1uFU2tJzEnCsHVse" alt="" height="201" width="602">

The panel below displays the details of the artifacts.

<img src="/files/V2JJXzbTJmuKxRmYq965" alt="" height="177" width="602">

* **Artifact** - Displays the name of the artifact.
* **Artifact Version** - Displays the version of the artifact.
* **Semantic Tags** - Displays the tags for the artifact that were sent in the build events.
* **Vulnerability** - Displays the number of vulnerabilities identified for the given artifact. On clicking it, the[ Vulnerabilities Management](https://docs.opsmx.com/opsmx-delivery-shield-platform/user-guide/vulnerability-management) details page is displayed.
* **Open Issues** - Displays the number of open security issues (alerts) identified for the given artifact.
* **Created on** - Displays the date when the artifact was created.
* **SBOM** - On clicking View, the SBOM page for the related artifact is displayed. Refer [SBOM](https://docs.opsmx.com/code-to-cloud-security-and-scanners/container-and-artifact-security/artifact-scanning/artifact-security/software-bill-of-materials-sbom) for more details.&#x20;
* **DBOM** - On clicking the displayed risk status, the DBOM page for the related artifact is displayed.
* **Actions** - On clicking the three dots, you can download the SBOM of the artifact.&#x20;


# Adhoc Source Scan Artifacts

The **Adhoc Source Artifacts** page displays the artifact status of all the Adhoc (refer to the artifacts that  are not part of the regular application, but are included on-demand) artifacts in the application.&#x20;

* The panel at the top displays the total number of adhoc artifacts and their risk status.&#x20;
  * **Critical Risk** - The deployments that are of critical risk.&#x20;
  * **High Risk** - The deployments that are of high risk.&#x20;
  * **Medium Risk** - The deployments that are of medium risk.&#x20;
  * **Low Risk** - The deployments that are of low risk.

<figure><img src="/files/zDzfjHuY7kxGU7aIcZ1Y" alt=""><figcaption></figcaption></figure>

The panel below displays the details of the Adhoc Source artifacts.

<figure><img src="/files/fdKMOTqej0dTCEAc5JeC" alt=""><figcaption></figcaption></figure>

* **Application -** Displays the name of the application.&#x20;
* **Account** - Displays the associated account name of the application.&#x20;
* **Artifact SHA** - Displays the specific version of the artifact.&#x20;
* **Artifact Version** - Displays the version of the artifact.&#x20;
* **Artifact Tags** - Displays the tags for the artifact that were sent in the build events.&#x20;
* **Risk Status** - Displays the risk status of the artifact.&#x20;
* **Stage** - Displays the life stage of the artifact.&#x20;
* **Vulnerability** - Displays the number of vulnerabilities identified for the given artifact. On clicking it, the [Vulnerabilities Management](https://docs.opsmx.com/opsmx-delivery-shield-platform/user-guide/vulnerability-management) details page is displayed.&#x20;
* **Open Issues** - Displays the number of open security issues (alerts) identified for the given artifact.&#x20;
* **Created on** - Displays the date when the artifact was created.&#x20;
* **Built by** - Displays the build details of the artifact.&#x20;
* **Source Repository** - Displays the source repository name of the artifact.&#x20;
* **Cluster** - Displays the name of the cluster to which the artifact belongs to.&#x20;
* **OSS Risk** - On clicking View, the OSS risk page for the related artifact is displayed.&#x20;
* **SBOM** - On clicking View, the SBOM page for the related artifact is displayed.&#x20;
* **DBOM** - On clicking the displayed risk status, the DBOM page for the related artifact is displayed.&#x20;
* **Actions** - On clicking the three dots, you can view the list of scans run on the artifact as shown below:

You can download the scan results by clicking on it.&#x20;

### View SBOM

The SBOM for the artifacts can be viewed by clicking the **View SBOM** option displayed in the page.&#x20;

<figure><img src="/files/qDjsJNQyQzeN2zK7a96K" alt=""><figcaption></figcaption></figure>

On clicking **View SBOM**, the SBOM page is displayed.&#x20;

<figure><img src="/files/xhjzf5i50uxfcSdT4pWH" alt=""><figcaption></figcaption></figure>

It displays the various components and related details of the components as shown below:

* **Component** - Displays the components of the artifact.
* **Version** - Displays the components version.&#x20;
* **Package URL** - Displays the package URL of the component.
* **License** - Displays the list of licenses that are available for the component.&#x20;
* **Vulnerabilities** - Displays the count of vulnerabilities related to the component.&#x20;
* **EOL Risk** - Displays the score of how close the OSS packages used in their project are towards End-of-Life (EOL).
* **Dependency** -&#x20;
* **OSS Risk** - By clicking **View**, you can view the artifact details of the component.&#x20;
* **Actions** - By clicking **Edit License**, you can edit the license type.

{% hint style="info" %}

* You can view the vulnerabilities of the components by clicking the **Vulnerabilities** column.&#x20;
  {% endhint %}

### View Report&#x20;

The SBOM details can be downloaded in PDF format.

* Navigate to the top right corner and click **Report**.&#x20;

<figure><img src="/files/ynhWFCpAHkxDfyKcOiWk" alt=""><figcaption></figcaption></figure>

* The page details is consolidated as a report and downloaded in PDF format as shown below:

<figure><img src="/files/kCbr1oRCpeIsI0NjPxul" alt=""><figcaption></figcaption></figure>

{% hint style="info" %}
You can also download the SBOM details in Json or .CSV file format by clicking the **Download** button.&#x20;
{% endhint %}


# Software Bill of Materials (SBOM)

Delivery Shield automates SBOM generation into existing workflows with dedicated support for technical issues and queries.

1. Navigate to **Setup → Integrations** in Delivery Shield.
2. Connect your container registry, CI/CD pipeline, and source repositories.
3. Enable **Syft /** **CDXGEN** integration.
4. Set the polling interval and target services for automated SBOM generation.
5. View generated SBOMs from the **SBOM** section of the **Artifact Security** page.
6. Export SBOMs on demand in **CycloneDX**, **SPDX**, or **JSON** format.

## Viewing SBOM Results in Delivery Shield

SBOM data is accessible from multiple locations within the platform:

* **SBOM Page** — org-wide SBOM view showing all components, versions, licenses, and CVE status per service
* **View Reports Page (Source Scan)** — downloadable SBOM report including the Vulnerability column per component
* **Artifact Pages** — a View SBOM button is available on all artifact pages, enabling a comprehensive SBOM view of all artifacts.&#x20;
* **Application Status Page** — displays the security status, active vulnerabilities, and alerts of running services derived from SBOM analysis.

{% hint style="info" %}
License data is visible in the downloaded SBOM file. Ensure you download the report to access full license information per component.
{% endhint %}

The SBOM pages for all the artifacts (Deployed / Generated / Plugin/ Mobile) can be accessed from the corresponding [Artifact Security](/code-to-cloud-security-and-scanners/container-and-artifact-security/artifact-scanning/artifact-security) page.&#x20;

### To Access SBOM for the Application&#x20;

The SBOM for the applications is available to view in the Artifact Security page.&#x20;

* Navigate to **Artifact Security** and click on the required artifacts page.&#x20;
* Click **View SBOM**.

<figure><img src="/files/G5TGzewjIq5aw5LYcRrv" alt=""><figcaption></figcaption></figure>

* The **SBOM** page is displayed.&#x20;

<figure><img src="/files/whA5ftazknPeLMSTVgRp" alt=""><figcaption></figcaption></figure>

{% hint style="info" %}
You can click **Download**, to download the complete details of the page.&#x20;

You can click **Licenses**, to download all the licenses available for the selected application.

You can click **Report**, to download this page in a report format.&#x20;
{% endhint %}

The page displays the different components and their details as follows:

* **Component** - Displays the component name.&#x20;
* **Version** - Displays the version of the displayed component.&#x20;
* **Package URL** - Displays the package URL of the component.&#x20;
* **License** - Displays all the available licenses.&#x20;
* **Vulnerabilities** - Displays the count of the vulnerabilities for the given component.&#x20;
* **EOL Risk** - Displays the EOL status of the component OSS package based on he score which user can add baseline version for a OSS project.
* **Dependency** - Displays the dependency of the components.&#x20;
* **Actions** - You can add or remove licenses by clicking the **Edit License** button.&#x20;

<figure><img src="/files/dPzQOCaR9nqE4oYHK7x3" alt=""><figcaption></figcaption></figure>

On clicking the Edit License option, the license details page is displayed. You can do the necessary changes and update the details.

<figure><img src="/files/37gWMADAD8ZykQqBOHrK" alt=""><figcaption></figcaption></figure>

### To Access SBOM for Individual Artifacts

The SBOM for the individual artifacts is available to view in the Artifact Security page.&#x20;

* Navigate to **Artifact Security** and click on the required artifacts page.&#x20;
* Click the view icon in the SBOM column, next to the required artifact.&#x20;

<figure><img src="/files/Dcz9O2nlDfm9JDDN7oBC" alt=""><figcaption></figcaption></figure>

* The **SBOM** page is displayed.&#x20;

<img src="/files/4hjwbu0qUBsjzY1Sv7cA" alt="" height="275" width="602">

{% hint style="info" %}

* Click **Download**, to download the complete details of the page.&#x20;
* Click **Licenses**, to download all the licenses available for the selected application.
* Click **Report**, to download this page in a report format (PDF or html).&#x20;
* Click **VEX Report** to download the details in json or csv file format.&#x20;
* The programming language associated with the scanned components is displayed, providing better visibility into application composition.&#x20;
  {% endhint %}

The page displays the different components of the artifact and their details as follows:

* **Component** - Displays the component name.&#x20;
* **Version** - Displays the version of the displayed component.&#x20;
* **Package URL** - Displays the package URL of the component.&#x20;
* **License** - Displays all the available licenses.&#x20;
* **Vulnerabilities** - Displays the count of the vulnerabilities for the given component.&#x20;
* **EOL Risk** - Displays the EOL status of the component OSS package based on he score which user can add baseline version for a OSS project.
* **Dependency** - Displays the dependency of the components.&#x20;
* **Actions** - You can add or remove licenses by clicking the **Edit License** button.&#x20;

<figure><img src="/files/dPzQOCaR9nqE4oYHK7x3" alt=""><figcaption></figcaption></figure>

On clicking the **Edit License** option, the license details page is displayed. You can do the necessary changes and update the details.

<figure><img src="/files/fnuFd0cnRMvnEIqSodaG" alt=""><figcaption></figcaption></figure>

### SBOM Levels

* The Complete SBOM, Top Level, N Level, Delivery and Transitive view of SBOM can be accessed from this page.

<img src="/files/LHdIeXJIuBV1gr01FrQ5" alt="" height="275" width="602">

* On clicking each panel the details of the corresponding level are displayed.&#x20;
  * **Top Level** - Provides a general summary of the software elements that are either integrated or directly used in a product. Essential details like component names, versions, and their interactions within the software are usually included.&#x20;
  * **N Level** - Goes beyond top-level overview to include deeper details and complexities. The "N" in "N-level" represents any arbitrary level of depth, indicating that the SBOM includes information at multiple tiers or levels of granularity.&#x20;
  * **Delivery** - Describes every part, library, and dependency that is part of a software release or delivery package. It offers clarity regarding the makeup of the software that is being supplied.
  * **Transitive** - Includes not only the direct dependencies of a software component but also its indirect or transitive dependencies.&#x20;
* On expanding the components, it provides a drill-down view that displays its dependencies of dependencies along with the corresponding vulnerability details.&#x20;

{% hint style="info" %}
For N Level you can choose (between 1 to 5) up to how many levels of dependencies you want to be listed.&#x20;
{% endhint %}

### SBOM Comparison

1. The SBOMs can be compared to identify differences in components, versions, licenses, and vulnerabilities.
2. Click the Compare icon in the SBOM column, next to the required artifact.&#x20;

<img src="/files/cYArzEw2NDyTTZ1z8lZZ" alt="" height="245" width="602">

3. The SBOM comparison page is displayed. Select the two SBOMs that you wish to compare from the dropdown and click **Compare**.&#x20;

<img src="/files/7UrRA69RxzuxjSY3NuhA" alt="" height="235" width="602">

The complete details of comparison are displayed as shown below:

<img src="/files/cLlNhsFXxIKBJ0CZuR3n" alt="" height="272" width="602">

<br>


# Remediation Agents & Factory Overview

Identifying risks is only the first step—organizations need to fix them quickly and safely. OpsMx provides remediation agents that can recommend, automate, and verify fixes across code, infrastructure, cloud, and deployment systems, while operating within governance and policy boundaries.


# Code Agent

AI Guardian is OpsMx's **AI-powered developer security tool** that finds, explains, and automatically fixes security vulnerabilities in your source code and dependencies — directly within your existing GitHub workflow. It connects to your repositories, runs SAST and SCA scans, and remediates issues by generating and raising pull requests automatically — all without requiring prior security expertise from the developer.

AI Guardian is the **pre-deployment security engine** in the OpsMx Dual-AI architecture — working alongside Argonaut (post-deployment operations) to create a complete, closed-loop security model from code to cloud.

## What Is AI Guardian

AI Guardian is a developer-facing security platform that:

* **Connects** to your GitHub repositories via a secure GitHub App integration.
* **Scans** source code and third-party dependencies automatically for known vulnerabilities.
* **Explains** each finding in plain language — no security expertise required.
* **Remediates** issues through an AI-powered interactive chat — generating code patches and raising pull requests in GitHub.
* **Monitors continuously** — auto-scanning repositories at configurable intervals so new vulnerabilities are caught as code evolves.
* **Secures pull requests** — automatically scanning every PR before it is merged, preventing new vulnerabilities from entering the main branch.

## Who Should Use AI Guardian

| Persona                 | How They Use AI Guardian                                                                                                     |
| ----------------------- | ---------------------------------------------------------------------------------------------------------------------------- |
| **Software Engineers**  | Get fast, inline feedback on code vulnerabilities — fix issues in minutes with AI-generated patches                          |
| **DevOps Teams**        | Automate security checks in CI/CD pipelines — PR scans and auto scans run continuously without manual intervention           |
| **Security Teams**      | Monitor and remediate risks across all repositories from a single dashboard — without requiring developers to switch tools   |
| **Product Owners**      | Ensure secure delivery without slowing development — AI Guardian runs in the background, surfacing only what needs attention |
| **Platform Architects** | Integrate AI-powered security into platform workflows — GitHub App integration requires no custom pipeline scripting         |

## Key Terms

| Term                   | Description                                                                                                                                        |
| ---------------------- | -------------------------------------------------------------------------------------------------------------------------------------------------- |
| **Hub**                | A central workspace where you group related GitHub projects to manage scanning and remediation — useful for managing multiple GitHub organizations |
| **GitHub Integration** | A secure connection between AI Guardian and your GitHub account that allows access to repositories via a GitHub App                                |
| **Project**            | A specific GitHub repository and branch that you want to scan and monitor                                                                          |
| **SAST**               | Static Application Security Testing — scans source code for security vulnerabilities without running the code                                      |
| **SCA**                | Software Composition Analysis — scans third-party libraries and dependencies for known CVEs and license risks                                      |
| **AI Remediation**     | AI-generated fix for a detected security issue — reviewed in an interactive chat and applied via an automated pull request                         |
| **PR Scan**            | Automatic security scan triggered on every pull request — reports only new vulnerabilities introduced by that specific PR                          |
| **Auto Scan**          | Scheduled, recurring scans at configurable intervals — ensures continuous security monitoring without manual intervention                          |
| **Chat History**       | Persistent remediation session history — allows developers to resume an in-progress remediation if interrupted or logged out                       |


# Functionalities of AI Guardian

## Key Capabilities

### **Hub Management**

AI Guardian organizes repositories into **Hubs** — centralized workspaces that group related GitHub projects together. This is particularly useful for organizations managing multiple GitHub organizations or large numbers of repositories, enabling team-level or org-level visibility and governance from a single dashboard.

### **GitHub Integration**

AI Guardian connects to GitHub via a **GitHub App** — a secure, permission-scoped integration that does not require personal access tokens to be shared or stored. Developers authorize the app, select the repositories to expose, and the integration is immediately active. Repository access can be expanded or restricted at any time.

### **SAST & SCA Scanning**

Every connected project is automatically scanned for:

| Scan Type | What It Catches                                                                                                    |
| --------- | ------------------------------------------------------------------------------------------------------------------ |
| **SAST**  | Source code vulnerabilities — insecure coding patterns, injection risks, insecure API usage, hardcoded credentials |
| **SCA**   | Dependency vulnerabilities — known CVEs in open-source libraries, outdated packages, license compliance risks      |

Findings are categorized by severity — **Critical, High, Medium, Low** — and each finding includes detailed context and AI-generated remediation guidance.

### **Single File Scan**

In addition to full repository scans, AI Guardian supports **single file scanning** — allowing developers to upload or select a specific source file for targeted SAST and SCA analysis. This is useful for quick validation before committing, reviewing changes in isolation, or scanning standalone files that fall outside normal project scope.

### **AI-Powered Remediation**

AI Guardian goes beyond reporting — it **fixes vulnerabilities automatically** using an AI-driven remediation workflow:

* Developer selects a finding and clicks **Remediate**
* An interactive chat explains the vulnerability and proposes a fix
* Developer reviews the code diff and refines the fix via chat if needed
* On approval, AI Guardian **creates a pull request** in GitHub with the fix applied
* Developer reviews and merges — the vulnerability is resolved

### **Chat History & Session Resumption**

Remediation sessions are persisted as **chat history** — allowing developers to resume an in-progress remediation even after logging out or a session expiry. Chat history is available for **2 days** from the start of a remediation session. Expired sessions are view-only and cannot be modified.

### **Auto Scan**

AI Guardian can automatically scan connected repositories at configurable intervals — ranging from every 5 minutes to every few days — ensuring **continuous security monitoring** without requiring developers to manually trigger scans. Auto scan detects new vulnerabilities as code evolves, immediately surfacing new risks.

### **PR Scan & Remediation**

AI Guardian integrates directly with the **GitHub pull request workflow** — automatically scanning every PR for security issues before it is merged into the main branch.

Key characteristics of PR Scan:

* Triggers automatically when a PR is **opened, updated with new commits, or reopened**
* Reports **only new vulnerabilities introduced by the PR** — reducing noise by excluding pre-existing issues
* Posts scan results as a **PR comment** — visible directly in the GitHub PR view
* Provides a **remediation URL** in the PR comment — developers click through to AI Guardian, select findings, and receive an AI-generated fix PR

### **Why PR Scan matters:**&#x20;

It catches vulnerabilities at the earliest possible moment in the merge process — before insecure code enters the main branch — with zero manual steps and no workflow configuration required from the developer.


# Setting Up AI Guardian

## How to Set Up Your AI Guardian Account

To set up your AI Guardian account, follow these steps below:

1. **Sign In:**
   * Sign in using your Google or GitHub account.
2. **Connect GitHub:**
   * Link your GitHub account to allow AI Guardian to access your repositories.
3. **Add Your First Project:**
   * Once connected, add your first project when prompted.
4. **Access the Dashboard:**
   * After adding the project, you will then be redirected to the main dashboard.


# Connecting to GitHub

Follow the steps given below to connect to GitHub.&#x20;

1. Click **Connect GitHub.**
2. Authorize the **GitHub App**.
3. Select the repositories to grant access.

The integration is now ready.


# Hub Management

Hub in AI Guardian allows you to manage centralized workspace management. If you have multiple GitHub Organizations to handle.

1. Click **Add Hub**.
2. Click **Create**.

You will automatically be redirected to the Integrations page. You can manage multiple Hubs, from AI Guardian. If you want to distinguish between your Git Organizations.


# Adding a Project

Follow the steps below to add a project.&#x20;

1. Click **Add Project**.&#x20;
2. Enter a **Project Name**.
3. Select the **GitHub Integration**.
4. Choose a repository (Use the search function in the dropdown to find the repositories).
5. Select a **branch** (Use the search function to find the branch).
6. Click **Save Project**.

Saving the project initiates the scanning process automatically.


# Editing a Project

You can modify the project configurations of the added projects. Follow the steps below for editing the project:

* Navigate to the project that you want to edit.&#x20;
* Click **Edit** to modify project settings.&#x20;
* Update auto scan intervals or other configurations as needed.&#x20;
* Save the changes.&#x20;


# Dashboard Overview

The dashboard is displayed after adding the project. You will be able to view the main dashboard and project dashboard.&#x20;

### Main Dashboard

The main dashboard allows you to:

* View all the recent scans.&#x20;
* Shows a detail visibility of the Scan activity trends.&#x20;

### Project Dashboard

The project dashboard allows you to:

* View the project scan status.&#x20;
* View the summary of all the findings.&#x20;

{% hint style="info" %}
To view the detailed results of any item click on it.&#x20;
{% endhint %}

### Download Scan Results

Follow the steps below to download the scan results.&#x20;

1. Open a **Project** > Navigate to **Findings**.&#x20;
2. Click **Download**.&#x20;
3. Select SAST or SCA.&#x20;

The findings are downloaded in JSON format.


# User Interface Overview

AI Guardian features a user-friendly and intuitive interface for easy navigation. Here are some useful features and their importance:

### AI Guardian Features:

| Feature                 | Advantage                                                                                                                 |
| ----------------------- | ------------------------------------------------------------------------------------------------------------------------- |
| Hub                     | Keeps your projects organized/centralized and easy to manage.                                                             |
| SAST/SCA Scans          | Helps you catch security issues early-before they reach production.                                                       |
| AI Remediation          | Saves time by suggesting safe fixes automatically.                                                                        |
| Pull Request Automation | Makes it easy to apply fixes without manual effort.                                                                       |
| Rescan Option           | Lets you verify fixes or monitor ongoing changes.                                                                         |
| Auto Scan               | Maintains continuous security monitoring without manual intervention, ensuring vulnerabilities are detected promptly.     |
| Chat History            | Allows you to resume remediation sessions seamlessly, preventing loss of progress if interrupted.                         |
| PR Scan                 | Automatically scans pull requests for security issues before merge, with minimal setup and no manual workflow management. |


# Scanning Codes

As soon as you save the project, AI Guardian begins scanning your code for:

* SAST issues (code-level vulnerabilities).
* SCA issues (library and dependency vulnerabilities).

After the scan completes:

* You will see a list of findings.
* Each finding is marked with a severity level (Critical, High, Medium, Low).
* Click **View** to see detailed information for each result.

## **Auto Scan Configuration**

AI Guardian can automatically scan your projects at regular intervals to ensure continuous security monitoring:

* Configure auto scan intervals (e.g., every 5 minutes, every 2 days)
* Once enabled, scans run automatically based on your specified schedule.
* Modify auto scan settings anytime by editing the project.

Auto scan helps maintain continuous security coverage without manual intervention, ensuring new vulnerabilities are detected promptly.


# Single File Scan

In addition to full repository scans, AI Guardian also allows you to scan a single source file.

* Select **Single File Scan**.
* Upload or choose a file.
* Start the scan.

The file is analyzed for SAST, SCA issues. Results are displayed with severity levels and AI-generated recommendations. This option is useful for quick validation, reviewing changes before committing, or scanning standalone files.


# Fixing Vulnerabilities with AI

AI Guardian helps you fix security issues using AI-generated suggestions.

### **To Remediate an Issue**

1. Select the issue you want to fix.
2. Click **Remediate**. Remediation views include an interactive chat to review and refine fixes.
3. Review the fix suggested by AI Guardian.&#x20;
4. Review the code changes.
5. Click **Approve**.

Once approved, AI Guardian creates a **Pull Request** in GitHub.

### **To Review and Merge the Pull Request**

1. Open the **Pull Request** created by AI Guardian.
2. Review the code changes in GitHub.&#x20;
3. If the changes look good, merge the **Pull Request**.

The fix is now applied to your repository.

### Rescan Anytime

After merging the Pull Request:

* You can rescan the project at any time.
* This helps confirm that the issue is fixed.
* It also checks for any new vulnerabilities.


# Chat History & Resuming Remediation

AI Guardian maintains a chat history of your remediation sessions, allowing you to resume where you left off:

* If you're logged out or your session expires during remediation, you can resume from your previous position.
* Access your remediation history to continue ongoing conversations.
* Chat history is available for 2 days from when the remediation begins.
* Expired history entries are view-only and cannot be modified.

This feature ensures that you don't lose progress if interrupted during the remediation process, making it easier to complete the security fixes efficiently.


# PR Scan & Remediation

PR Scan is a pull request–level security feature that automatically scans code changes for security issues before they are merged. It integrates directly with your GitHub pull request workflow to detect new vulnerabilities introduced by a PR and helps developers fix them by generating remediation pull requests with suggested changes.

This ensures security issues are identified and addressed early, without adding manual steps to the development workflow.

### 1. Prerequisites

* Ensure your main branch is registered with AI Guardian.
* Ensure AI Guardian has access to the GitHub repository.

### 2. Enable PR Workflow

1. Go to the **Projects** page in AI Guardian.
2. Locate your project and click **Edit**.
3. Toggle **Enable PR Workflow**.
4. When enabled, a confirmation popup appears with the following information:
   * Enabling the PR workflow will create a pull request in your repository containing the workflow configuration file.
   * You must merge this pull request to complete the setup and activate the PR workflow.
   * Once enabled, this action cannot be undone through the UI.
5. Click **Enable** and **Create PR**.
6. Review and merge the auto-generated pull request in GitHub.

After the PR is merged, the PR workflow becomes active.

### 3. Triggering the PR Scan

1. Create a feature branch (for example, dev) and push your changes.
2. Raise a Pull Request to merge: dev → main
3. The PR scan automatically triggers when the PR is:
   * Opened
   * Updated with new commits
   * Reopened

During execution:

* AI Guardian receives PR metadata (PR number, source branch, target branch, PR URL).
* A PR comment confirms that the scan has started.

### 4. Viewing Scan Results

* Scan results are posted directly as a comment on the PR.
* Results include:
  * SAST findings (code vulnerabilities)
  * SCA findings (dependency vulnerabilities)
* Only new vulnerabilities introduced by the PR are reported.

### 5. Remediation Workflow

1. Click the Remediation URL provided in the PR comment.
2. Select the vulnerabilities identified in the scan.
3. AI Guardian creates a remediation pull request with suggested fixes.
4. An interactive remediation chat:
   * Explains the fixes
   * Allows review and clarification before applying changes
5. The PR scan runs again on the remediation PR.
6. If the scan is clean:
   * Merge the remediation PR into the feature branch
   * Then merge the feature branch into main

### 6. Importance of PR Scan&#x20;

* **Automated Security Checks**: Every pull request undergoes automatic security verification.
* **Minimal Setup**: Simplified setup directly through the user interface without workflow or secret management.
* **Efficient Onboarding**: Quick initiation with standardized configurations.
* **Developer-Friendly Remediation**: Automatically generate fix pull requests to help developers address issues.
* **Continuous Security Assurance**: Ensure secure code is consistently deployed to production.


---

[Next Page](/llms-full.txt/1)